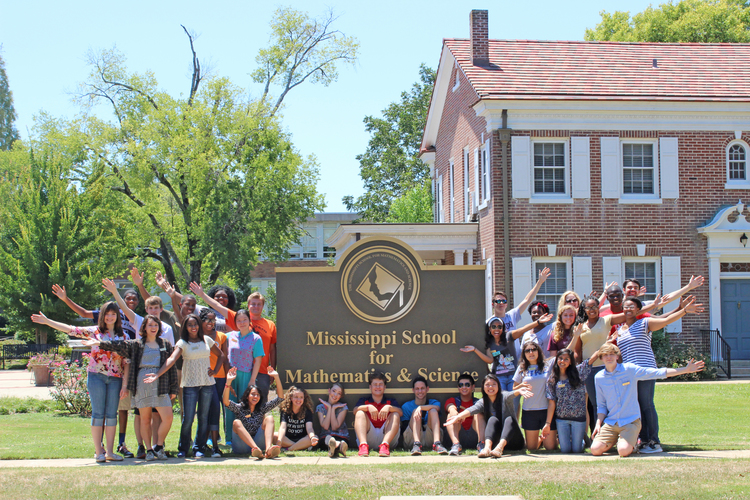
The kids in Columbus, Mississippi are clearly smart. However, the 89% rest of the state is struggling to prepare for college, but they nonetheless aspire to go to Mississippi State University; these are the key takeaways from the ACT scores of Mississippi’s graduating class of 2017.
(Scroll down for table of ACT results for all 241 Mississippi high schools)
As with 19 other states, Mississippi requires and pays for all of the state’s public school students to take the ACT in the spring of their junior year. ACT test scores account for 5% of a school’s annual accountability rating.
In 2016, 35,678 students took the ACT; their mean composite score was an 18.4 out of 36 meaning that the average Mississippi junior scored worse than 64% of other test takers. Nationwide, the average composite score was a 20.8. Of the 20 states with complete or near mandatory ACT testing, Minnesota scored the highest with a score of 21.1. Only Nevada scored worse than Mississippi with a composite score of 17.7.
ACT College Readiness Benchmarks
Almost half of all Mississippians are prepared to do well in college English, but only 11% would survive interdisciplinary coursework in science, technology, engineering, and math (STEM).
“College Readiness Benchmarks” are the subtest scores (out of 36) that the ACT thinks are necessary for a student to have a 50% chance of earning a B or higher or a 75% chance of getting a C or higher on a freshman level college course. Effective of 2013, these benchmark scores and their college course equivalents are:
- English (English Composition) – 18
- Reading (Social Sciences) – 22
- Mathematics (College Algebra) – 22
- Science (Biology) – 23
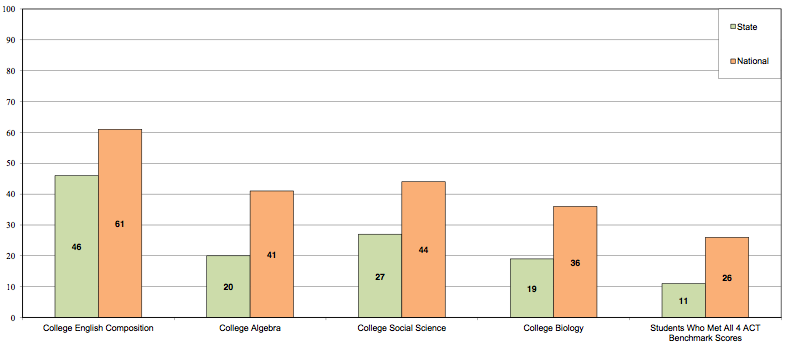
Percent of Mississippi students ready for college-level coursework (green) versus the nation (orange)
Mississippi’s seniors did best in English, where the ACT says that 46% are ready for college-level coursework. However, they did far worse in Reading (27%), Math (20%), and Science (19%); they barely registered for STEM (11%).
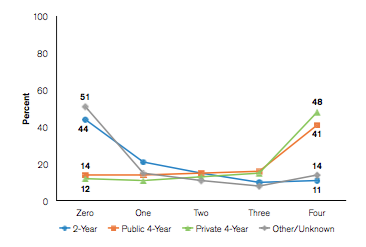
Percent of 2015 ACT-Tested High School Graduates by Number of ACT College Readiness Benchmarks Attained and Fall 2015 College Enrollment Status (ACT Inc.)
Compared to the rest of the United States, Mississippi’s seniors are more than twice as unlikely to succeed in college when looking at all four tested areas.
It should come as no surprise that students passing all four benchmarks nationwide (English, Reading, Mathematics, and Science) were most likely to attend 4-year private and public colleges.
48% of students passing all four benchmarks ultimately attended private 4-year colleges while 41% attended 4-year public colleges.
Disappointingly, 51% of students who didn’t pass any benchmarks fell off of the college radar altogether.
Racial and Economic Disparities
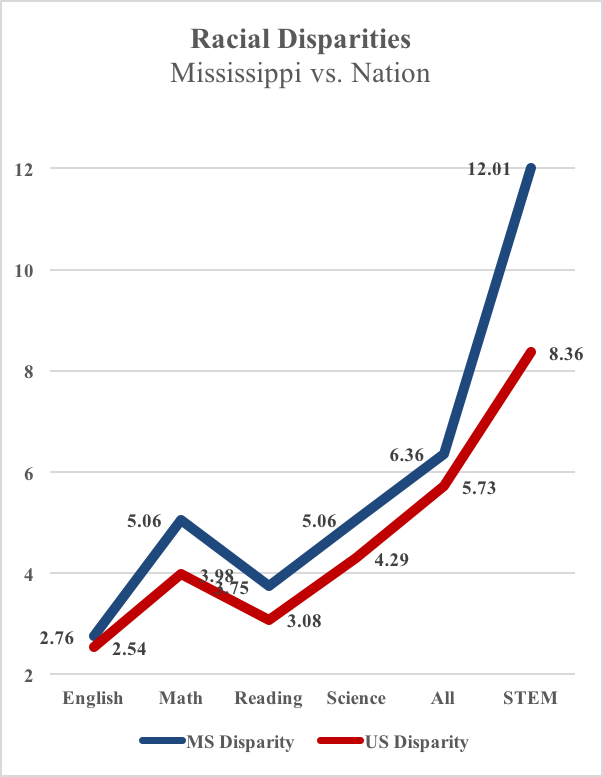
Significant disparities exist among ACT scores between students of different races. Nationwide, white students are between 2 and 8 times as likely to be college ready than their black counterparts.
Piqosity analysis of ACT data
In Mississippi this disparity is more severe. While the gap between whites and blacks is similar to the nation in English, it’s most extreme when examining readiness in STEM fields (science, technology, engineering, and mathematics); here white students are 12 times more likely to be prepared for college than their black counterparts.
However, income disparity is perhaps a better explanation for the performance gap. In Piqosity’s analysis of Mississippi schools, there was a nearly 72% correlation between ACT composite scores and the percentage of a school’s students who benefitted from free and reduced lunch programs.
At a 64% correlation, race too was a good predictor of test results, but not as strong as the economic indicator. This analysis supports general nationwide findings that point to the children of rich families scoring significantly higher on the ACT than their less well-off counterparts.
According to the ACT’s own internal research, 67% of children from families earning more than $100,000 and taking the ACT’s recommended “core curriculum” are college and career ready. Conversely, only 11% of children from families earning less than $36,000 a year and not taking the recommended curriculum were ready. Mississippi’s median household income in 2014 was $39,464.
The top 10 Mississippi schools by ACT scores had an average free and reduced lunch population of just 31%, twice as better off than the state average of 72%. Behind only MSMS, number 2 Madison Central’s low income population is just 17%. Conversely, the bottom 50 Mississippi schools have low income populations of 93%.
Obtainable College Preferences
While the majority of Mississippi’s graduating seniors may not breeze through college, the good news is that the state wants them to try, and Mississippians love their state colleges.
Out of 35,678 students who took the ACT last year, nearly three quarters listed Mississippi State, Ole Miss, or Southern among their top choices. The top five colleges among test takers were:
- Mississippi State (12,731)
- University of Mississippi (8,932)
- University of Southern Mississippi (6,680)
- Jackson State University (3,342)
- Jones County Junior College (2,727)
These colleges are accessible too. At Mississippi State, an applicant will be granted admission if they maintain a high school GPA of 2.5 and score at least a 16 composite on the ACT; the majority of students at 187 of Mississippi’s 241 schools earned a 16 or higher last year.
ACT Scores for All Mississippi Public High Schools
Out of 241 public high schools, the majority of students were college ready in English at 93 schools; however, only 3 were as prepared for math, and just Mississippi School for Math and Science graduated a majority of seniors who were college ready in science.

How to Read This Sortable Table
- The default sort is by highest composite score from highest to lowest; to change the sorting order, click on the header that you want to sort by
- “Avg Score” is the composite ACT score from 0 to 36
- “% Rank” shows the percentage of students who scored lower
- “% Tested” refers to the estimated percentage of seniors who took the ACT
- “English, Math, Reading, Science” refers to the school’s average scores in each sub-test
- “# Tested” is the number of students who sat for the exam at each shcool
| Rank | School | Avg Score | % Rank | English | Math | Reading | Science | # Tested |
|---|---|---|---|---|---|---|---|---|
| 1 | MISSISSIPPI SCHOOL FOR MATH AND SCIENCE | 29.0 | 92 | 29.6 | 27.9 | 29.8 | 28.0 | 123 |
| 2 | MADISON CENTRAL HIGH | 22.7 | 83 | 23.3 | 22.0 | 22.6 | 22.3 | 382 |
| 3 | MISSISSIPPI SCHOOL FOR THE ARTS | 22.4 | 63 | 23.9 | 19.5 | 24.7 | 21.2 | 60 |
| 4 | OXFORD HIGH SCHOOL | 22.2 | 63 | 22.7 | 22.0 | 21.8 | 21.7 | 277 |
| 5 | GERMANTOWN HIGH SCHOOL | 21.6 | 63 | 22.2 | 20.4 | 21.8 | 21.5 | 237 |
| 6 | LEWISBURG HIGH SCHOOL | 21.3 | 56 | 21.9 | 20.4 | 21.4 | 21.1 | 221 |
| 7 | LONG BEACH HIGH SCHOOL | 21.3 | 56 | 21.8 | 20.7 | 21.2 | 21.2 | 206 |
| 8 | NORTHWEST RANKIN HIGH | 21.3 | 56 | 21.6 | 20.4 | 21.5 | 21.3 | 362 |
| 9 | OCEAN SPRINGS HIGH SCHOOL | 21.2 | 56 | 20.7 | 20.3 | 21.7 | 21.6 | 407 |
| 10 | VANCLEAVE HIGH SCHOOL | 20.9 | 56 | 21.1 | 20.7 | 20.9 | 20.6 | 157 |
| 11 | ENTERPRISE HIGH SCHOOL | 20.8 | 56 | 21.0 | 21.3 | 20.1 | 20.3 | 56 |
| 12 | GULFPORT HIGH SCHOOL | 20.8 | 56 | 21.4 | 20.1 | 20.1 | 21.1 | 286 |
| 13 | WEST LINCOLN SCHOOL | 20.8 | 56 | 20.9 | 20.4 | 20.3 | 20.9 | 59 |
| 14 | WEST LAUDERDALE HIGH SCHOOL | 20.7 | 56 | 19.9 | 20.9 | 20.6 | 20.9 | 142 |
| 15 | PASS CHRISTIAN HIGH | 20.6 | 56 | 20.2 | 20.3 | 20.9 | 20.4 | 124 |
| 16 | BILOXI HIGH SCHOOL | 20.6 | 56 | 20.8 | 19.7 | 20.9 | 20.4 | 360 |
| 17 | CENTER HILL HIGH SCHOOL | 20.4 | 50 | 20.8 | 19.9 | 19.9 | 20.5 | 222 |
| 18 | DESOTO CENTRAL HIGH | 20.4 | 50 | 20.0 | 20.2 | 20.5 | 20.2 | 396 |
| 19 | WEST UNION ATTENDANCE CENTER | 20.4 | 50 | 20.0 | 20.3 | 20.4 | 20.4 | 38 |
| 20 | EAST CENTRAL HIGH SCHOOL | 20.3 | 50 | 20.1 | 19.4 | 20.7 | 20.6 | 173 |
| 21 | PEARL RIVER CENTRAL HIGH SCHOOL | 20.3 | 50 | 20.4 | 19.5 | 20.8 | 20.2 | 204 |
| 22 | CLARKDALE HIGH SCHOOL | 20.3 | 50 | 22.3 | 19.0 | 19.8 | 19.8 | 54 |
| 23 | MANTACHIE HIGH SCHOOL | 20.3 | 50 | 19.7 | 19.6 | 20.7 | 20.6 | 67 |
| 24 | BRANDON HIGH SCHOOL | 20.3 | 50 | 20.0 | 19.8 | 20.2 | 20.7 | 340 |
| 25 | HANCOCK HIGH SCHOOL | 20.2 | 50 | 19.6 | 19.6 | 20.6 | 20.5 | 261 |
| 26 | NEW SITE HIGH SCHOOL | 20.2 | 50 | 19.2 | 19.3 | 21.5 | 20.3 | 65 |
| 27 | WEST HARRISON HIGH SCHOOL | 20.2 | 50 | 20.1 | 19.8 | 19.8 | 20.4 | 180 |
| 28 | OAK GROVE HIGH SCHOOL | 20.1 | 50 | 20.0 | 20.4 | 20.0 | 19.7 | 398 |
| 29 | SENATOBIA HIGH SCHOOL | 20.1 | 50 | 20.5 | 19.3 | 20.1 | 20.0 | 112 |
| 30 | SAINT MARTIN HIGH SCHOOL | 20.1 | 50 | 20.0 | 19.1 | 20.4 | 20.3 | 233 |
| 31 | AMORY HIGH SCHOOL | 20.0 | 50 | 19.9 | 19.9 | 19.7 | 20.2 | 131 |
| 32 | SALTILLO HIGH SCHOOL | 20.0 | 50 | 19.2 | 19.7 | 20.2 | 20.3 | 213 |
| 33 | BELMONT HIGH SCHOOL | 20.0 | 50 | 19.3 | 19.6 | 20.4 | 20.2 | 68 |
| 34 | CORINTH HIGH SCHOOL | 20.0 | 50 | 20.2 | 19.4 | 19.9 | 20.2 | 136 |
| 35 | PETAL HIGH SCHOOL | 20.0 | 50 | 19.3 | 20.1 | 20.0 | 20.0 | 293 |
| 36 | CALEDONIA HIGH SCHOOL | 20.0 | 50 | 19.3 | 19.6 | 20.3 | 20.3 | 139 |
| 37 | FLORENCE HIGH SCHOOL | 20.0 | 50 | 19.5 | 19.4 | 20.2 | 20.3 | 156 |
| 38 | GEORGE COUNTY HIGH SCHOOL | 19.9 | 50 | 19.9 | 19.5 | 19.8 | 19.9 | 267 |
| 39 | ITAWAMBA AGRICULTURAL HIGH SCHOOL | 19.9 | 50 | 19.1 | 20.1 | 20.0 | 19.9 | 121 |
| 40 | EAST UNION ATTENDANCE CENTER | 19.9 | 50 | 19.6 | 19.1 | 20.1 | 20.2 | 58 |
| 41 | DIBERVILLE HIGH SCHOOL | 19.9 | 50 | 19.4 | 19.5 | 20.0 | 20.3 | 256 |
| 42 | SOUTH JONES HIGH SCHOOL | 19.9 | 50 | 19.7 | 19.0 | 20.5 | 19.9 | 156 |
| 43 | NEW ALBANY HIGH SCHOOL | 19.9 | 50 | 19.3 | 19.8 | 20.1 | 19.8 | 119 |
| 44 | MOOREVILLE HIGH SCHOOL | 19.9 | 50 | 20.0 | 19.2 | 19.7 | 20.0 | 110 |
| 45 | WINONA HIGH SCHOOL | 19.9 | 50 | 19.4 | 19.5 | 19.6 | 20.4 | 63 |
| 46 | HERNANDO HIGH SCHOOL | 19.8 | 50 | 19.4 | 19.4 | 20.0 | 20.1 | 266 |
| 47 | EUPORA HIGH SCHOOL | 19.8 | 50 | 19.3 | 20.1 | 19.2 | 20.4 | 53 |
| 48 | BAY HIGH SCHOOL | 19.7 | 50 | 19.7 | 18.3 | 20.4 | 19.9 | 126 |
| 49 | NANIH WAIYA SCHOOL | 19.7 | 50 | 19.2 | 20.0 | 20.2 | 19.0 | 36 |
| 50 | OLIVE BRANCH HIGH SCHOOL | 19.7 | 50 | 19.4 | 19.5 | 19.7 | 19.7 | 224 |
| 51 | WEST JONES JR SR HIGH SCHOOL | 19.7 | 50 | 19.4 | 19.4 | 19.7 | 19.6 | 201 |
| 52 | NORTH PIKE SENIOR HIGH | 19.7 | 50 | 19.7 | 19.2 | 19.7 | 19.6 | 176 |
| 53 | PUCKETT ATTENDANCE CENTER | 19.7 | 50 | 19.2 | 19.8 | 19.2 | 19.9 | 62 |
| 54 | UNION HIGH SCHOOL | 19.7 | 50 | 20.0 | 19.2 | 19.9 | 19.3 | 62 |
| 55 | LAFAYETTE JR SR HIGH SCHOOL | 19.5 | 50 | 19.3 | 19.8 | 19.0 | 19.5 | 173 |
| 56 | RIDGELAND HIGH SCHOOL | 19.5 | 50 | 19.3 | 18.9 | 19.5 | 19.8 | 181 |
| 57 | TREMONT HIGH SCHOOL | 19.3 | 43 | 19.2 | 19.5 | 18.8 | 19.6 | 32 |
| 58 | EAST WEBSTER HIGH SCHOOL | 19.3 | 43 | 18.4 | 19.3 | 19.4 | 19.6 | 63 |
| 59 | RICHLAND HIGH SCHOOL | 19.3 | 43 | 19.1 | 18.3 | 19.3 | 19.8 | 126 |
| 60 | FALKNER HIGH SCHOOL | 19.3 | 43 | 19.2 | 18.1 | 20.0 | 19.0 | 28 |
| 61 | PEARL HIGH SCHOOL | 19.2 | 43 | 18.8 | 18.8 | 19.5 | 19.1 | 237 |
| 62 | SOUTH PONTOTOC HIGH | 19.2 | 43 | 18.0 | 18.7 | 19.7 | 19.8 | 94 |
| 63 | TUPELO HIGH SCHOOL | 19.1 | 43 | 18.8 | 18.9 | 19.1 | 19.3 | 419 |
| 64 | KOSCIUSKO SENIOR HIGH SCHOOL | 19.1 | 43 | 18.9 | 18.1 | 19.2 | 19.6 | 137 |
| 65 | SUMRALL JR SR HIGH SCHOOL | 19.1 | 43 | 19.0 | 18.5 | 19.6 | 18.7 | 118 |
| 66 | TAYLORSVILLE HIGH SCHOOL | 19.1 | 43 | 19.4 | 18.5 | 18.3 | 19.3 | 43 |
| 67 | POPLARVILLE HIGH SCHOL | 19.1 | 43 | 18.4 | 18.7 | 19.4 | 19.3 | 146 |
| 68 | BOONEVILLE HIGH SCHOOL | 19.1 | 43 | 19.2 | 18.6 | 19.3 | 18.6 | 98 |
| 69 | CLINTON HIGH SCHOOL | 19.0 | 43 | 18.4 | 18.6 | 19.0 | 19.6 | 325 |
| 70 | NESHOBA CENTRAL HIGH | 19.0 | 43 | 18.5 | 18.4 | 19.6 | 19.0 | 211 |
| 71 | SEBASTOPOL ATTENDANCE CENTER | 19.0 | 43 | 18.1 | 18.9 | 18.7 | 19.7 | 31 |
| 72 | PINE GROVE HIGH SCHOOL | 18.9 | 43 | 18.0 | 18.9 | 19.3 | 18.8 | 34 |
| 73 | JUMPERTOWN HIGH SCHOOL | 18.9 | 43 | 17.6 | 19.4 | 19.1 | 19.0 | 20 |
| 74 | PONTOTOC HIGH SCHOOL | 18.8 | 43 | 17.9 | 18.9 | 18.7 | 19.2 | 141 |
| 75 | ALCORN CENTRAL HIGH | 18.8 | 43 | 18.9 | 17.8 | 19.3 | 18.8 | 91 |
| 76 | KOSSUTH HIGH SCHOOL | 18.8 | 43 | 17.9 | 18.8 | 19.1 | 19.0 | 105 |
| 77 | STONE SENIOR HIGH SCHOOL | 18.8 | 43 | 18.6 | 17.7 | 19.4 | 19.0 | 157 |
| 78 | ETHEL HIGH SCHOOL | 18.7 | 43 | 18.0 | 18.3 | 18.7 | 19.2 | 46 |
| 79 | STRINGER ATTENDANCE CENTER | 18.7 | 43 | 18.6 | 18.5 | 18.8 | 18.5 | 40 |
| 80 | BALDWYN HIGH SCHOOL | 18.7 | 43 | 18.2 | 18.2 | 19.6 | 18.5 | 64 |
| 81 | FORREST COUNTY AGRICULTURAL HIGH SCHOOL | 18.7 | 43 | 17.6 | 17.9 | 19.5 | 19.2 | 121 |
| 82 | COLUMBIA HIGH SCHOOL | 18.6 | 43 | 18.2 | 17.9 | 19.1 | 19.1 | 111 |
| 83 | MYRTLE ATTENDANCE CENTER | 18.6 | 43 | 18.7 | 17.5 | 18.6 | 18.9 | 46 |
| 84 | GAUTIER HIGH SCHOOL | 18.6 | 43 | 18.0 | 17.9 | 18.6 | 19.2 | 188 |
| 85 | HATLEY HIGH SCHOOL | 18.5 | 43 | 17.8 | 18.0 | 19.0 | 19.1 | 75 |
| 86 | SEMINARY HIGH SCHOOL | 18.5 | 43 | 18.4 | 18.2 | 18.4 | 18.7 | 73 |
| 87 | SMITHVILLE HIGH SCHOOL | 18.5 | 43 | 18.0 | 18.2 | 17.7 | 19.6 | 45 |
| 88 | SOUTHAVEN HIGH SCHOOL | 18.4 | 33 | 17.6 | 18.3 | 18.4 | 18.7 | 380 |
| 89 | NORTHEAST LAUDERDALE HIGH SCHOOL | 18.4 | 33 | 18.1 | 17.8 | 18.5 | 18.8 | 120 |
| 90 | INGOMAR ATTENDANCE CENTER | 18.4 | 33 | 18.1 | 17.4 | 18.7 | 18.7 | 51 |
| 91 | LAKE ATTENDANCE CENTER | 18.4 | 33 | 18.4 | 17.8 | 18.4 | 18.5 | 45 |
| 92 | RIVERSIDE HIGH SCHOOL | 18.4 | 33 | 18.5 | 17.3 | 18.4 | 18.9 | 45 |
| 93 | CLEVELAND HIGH SCHOOL | 18.3 | 33 | 18.3 | 17.7 | 18.3 | 18.6 | 126 |
| 94 | WESSON ATTENDANCE CENTER | 18.3 | 33 | 17.5 | 17.9 | 18.5 | 18.7 | 84 |
| 95 | GRENADA HIGH SCHOOL | 18.3 | 33 | 16.8 | 18.7 | 18.3 | 18.8 | 218 |
| 96 | NORTH PONTOTOC HIGH | 18.3 | 33 | 16.9 | 17.7 | 18.5 | 19.3 | 93 |
| 97 | TISHOMINGO HIGH SCHOOL | 18.3 | 33 | 17.4 | 18.2 | 18.7 | 18.0 | 168 |
| 98 | SOUTHEAST LAUDERDALE HIGH SCHOOL | 18.2 | 33 | 17.7 | 17.5 | 18.4 | 18.8 | 107 |
| 99 | LAKE CORMORANT HIGH | 18.2 | 33 | 17.9 | 17.7 | 18.2 | 18.6 | 211 |
| 100 | BLUE MOUNTAIN SCHOOL | 18.2 | 33 | 18.5 | 17.5 | 17.8 | 18.6 | 14 |
| 101 | PELAHATCHIE ATTENDANCE CENTER | 18.2 | 33 | 18.3 | 17.5 | 17.8 | 18.7 | 61 |
| 102 | HOUSTON HIGH SCHOOL | 18.2 | 33 | 18.0 | 17.5 | 18.0 | 18.9 | 104 |
| 103 | SCOTT CENTRAL ATTENDANCE CENTER | 18.2 | 33 | 17.3 | 18.2 | 18.3 | 18.6 | 51 |
| 104 | NORTHEAST JONES HIGH | 18.2 | 33 | 17.5 | 17.7 | 18.3 | 18.5 | 165 |
| 105 | NORTH FORREST HIGH SCHOOL | 18.1 | 33 | 17.3 | 18.0 | 18.3 | 18.6 | 47 |
| 106 | HARRISON CENTRAL HIGH | 18.1 | 33 | 17.4 | 17.9 | 18.3 | 18.5 | 357 |
| 107 | INDEPENDENCE HIGH SCHOOL | 18.1 | 33 | 17.6 | 18.0 | 17.7 | 18.6 | 91 |
| 108 | MCLAURIN ATTENDANCE CENTER | 18.1 | 33 | 17.6 | 17.3 | 18.4 | 18.8 | 86 |
| 109 | BROOKHAVEN HIGH SCHOOL | 18.1 | 33 | 17.4 | 17.7 | 18.3 | 18.5 | 151 |
| 110 | ENTERPRISE ATTENDANCE CENTER | 18.1 | 33 | 16.9 | 17.6 | 18.4 | 19.0 | 63 |
| 111 | STARKVILLE HIGH SCHOOL | 18.1 | 33 | 17.2 | 17.8 | 18.2 | 18.7 | 264 |
| 112 | RICHTON HIGH SCHOOL | 18.1 | 33 | 17.0 | 18.1 | 18.0 | 18.6 | 45 |
| 113 | GREENE COUNTY HIGH SCHOOL | 18.1 | 33 | 17.0 | 17.1 | 19.2 | 18.4 | 157 |
| 114 | NEWTON COUNTY HIGH SCHOOL | 18.0 | 33 | 17.6 | 17.4 | 17.9 | 18.6 | 147 |
| 115 | LOYD STAR SCHOOL | 18.0 | 33 | 18.0 | 17.5 | 17.9 | 18.1 | 63 |
| 116 | PISGAH HIGH SCHOOL | 18.0 | 33 | 18.0 | 18.3 | 17.2 | 18.3 | 63 |
| 117 | STRAYHORN HIGH SCHOOL | 18.0 | 33 | 17.0 | 18.5 | 17.8 | 18.3 | 66 |
| 118 | MCADAMS HIGH SCHOOL | 18.0 | 33 | 18.1 | 15.7 | 18.6 | 18.9 | 29 |
| 119 | BOGUE CHITTO SCHOOL | 18.0 | 33 | 16.9 | 17.9 | 18.0 | 18.4 | 50 |
| 120 | NEW HOPE HIGH SCHOOL | 18.0 | 33 | 16.9 | 18.0 | 17.8 | 18.7 | 153 |
| 121 | PASCAGOULA HIGH SCHOOL | 17.9 | 33 | 17.3 | 17.8 | 17.5 | 18.6 | 252 |
| 122 | PICAYUNE MEMORIAL HIGH | 17.9 | 33 | 16.9 | 17.6 | 18.3 | 18.4 | 208 |
| 123 | WILLIAM MURRAH HIGH SCHOOL | 17.9 | 33 | 17.5 | 17.1 | 18.1 | 18.4 | 333 |
| 124 | WATER VALLEY HIGH SCHOOL | 17.9 | 33 | 16.7 | 18.4 | 17.7 | 18.3 | 70 |
| 125 | WALNUT ATTENDANCE CENTER | 17.8 | 33 | 17.1 | 17.1 | 18.2 | 18.6 | 46 |
| 126 | MIZE ATTENDANCE CENTER | 17.8 | 33 | 17.3 | 18.4 | 17.0 | 18.0 | 51 |
| 127 | POTTS CAMP SCHOOL | 17.7 | 33 | 17.4 | 17.6 | 16.9 | 18.3 | 39 |
| 128 | HORN LAKE HIGH SCHOOL | 17.7 | 33 | 17.1 | 17.4 | 17.8 | 18.0 | 325 |
| 129 | PURVIS HIGH SCHOOL | 17.6 | 33 | 17.2 | 17.6 | 18.0 | 17.4 | 134 |
| 130 | NETTLETON HIGH SCHOOL | 17.6 | 33 | 16.4 | 18.1 | 17.6 | 18.2 | 76 |
| 131 | THRASHER SCHOOL | 17.6 | 33 | 16.5 | 17.9 | 16.7 | 18.9 | 27 |
| 132 | LUMBERTON JR SR HIGH SCHOOL | 17.6 | 33 | 15.2 | 17.5 | 17.6 | 19.1 | 38 |
| 133 | NATCHEZ EARLY COLLEGE ACADEMY | 17.5 | 33 | 17.1 | 16.2 | 16.7 | 19.7 | 21 |
| 134 | WHEELER HIGH SCHOOL | 17.5 | 33 | 17.1 | 18.2 | 17.7 | 16.3 | 23 |
| 135 | RIPLEY HIGH SCHOOL | 17.5 | 33 | 15.7 | 17.2 | 18.1 | 18.2 | 114 |
| 136 | HOULKA ATTENDANCE CENTER | 17.5 | 33 | 17.5 | 17.0 | 17.5 | 17.2 | 28 |
| 137 | LAWRENCE COUNTY HIGH | 17.5 | 33 | 16.4 | 17.8 | 17.6 | 17.6 | 134 |
| 138 | EAST MARION HIGH SCHOOL | 17.4 | 30.0 | 17.2 | 16.8 | 17.1 | 17.8 | 45 |
| 139 | SOUTH PANOLA HIGH SCHOOL | 17.4 | 30.0 | 17.0 | 17.6 | 17.3 | 17.5 | 260 |
| 140 | HAMILTON HIGH SCHOOL | 17.4 | 30.0 | 16.3 | 17.6 | 17.8 | 17.4 | 41 |
| 141 | TERRY HIGH SCHOOL | 17.3 | 30.0 | 16.7 | 16.7 | 17.5 | 18.0 | 265 |
| 142 | RAYMOND HIGH SCHOOL | 17.3 | 30.0 | 17.0 | 16.8 | 17.0 | 17.9 | 143 |
| 143 | CHOCTAW COUNTY HIGH SCHOOL | 17.3 | 30.0 | 16.4 | 17.2 | 17.1 | 17.6 | 67 |
| 144 | WARREN CENTRAL HIGH | 17.3 | 30.0 | 15.8 | 17.4 | 17.5 | 18.1 | 270 |
| 145 | BIGGERSVILLE HIGH SCHOOL | 17.2 | 30.0 | 15.9 | 17.3 | 17.4 | 17.9 | 36 |
| 146 | WEST MARION HIGH SCHOOL | 17.2 | 30.0 | 16.5 | 16.9 | 17.6 | 17.4 | 68 |
| 147 | PHILADELPHIA HIGH SCHOOL | 17.2 | 30.0 | 17.4 | 16.8 | 16.3 | 17.7 | 58 |
| 148 | MERIDIAN HIGH SCHOOL | 17.1 | 30.0 | 15.9 | 16.8 | 17.1 | 18.0 | 277 |
| 149 | VARDAMAN HIGH SCHOOL | 17.1 | 30.0 | 14.8 | 17.6 | 17.6 | 18.0 | 29 |
| 150 | BRUCE HIGH SCHOOL | 17.1 | 30.0 | 16.1 | 17.0 | 17.5 | 17.1 | 69 |
| 151 | QUITMAN HIGH SCHOOL | 17.0 | 30.0 | 16.4 | 17.1 | 16.5 | 17.6 | 116 |
| 152 | AMITE COUNTY HIGH SCHOOL | 17.0 | 30.0 | 16.5 | 16.3 | 17.8 | 17.2 | 44 |
| 153 | NOXAPATER HIGH SCHOOL | 17.0 | 30.0 | 16.8 | 16.4 | 16.4 | 18.1 | 30 |
| 154 | WAYNE COUNTY HIGH SCHOOL | 17.0 | 30.0 | 15.7 | 16.9 | 17.5 | 17.5 | 224 |
| 155 | HICKORY FLAT ATTENDANCE CENTER | 17.0 | 30.0 | 16.6 | 17.0 | 17.1 | 16.9 | 43 |
| 156 | J Z GEORGE HIGH SCHOOL | 16.9 | 30.0 | 16.1 | 16.8 | 16.5 | 18.0 | 76 |
| 157 | CALHOUN CITY HIGH SCHOOL | 16.9 | 30.0 | 16.1 | 16.9 | 17.2 | 16.8 | 61 |
| 158 | FRANKLIN HIGH SCHOOL | 16.9 | 30.0 | 15.9 | 16.4 | 17.2 | 17.7 | 90 |
| 159 | COFFEEVILLE HIGH SCHOOL | 16.7 | 30.0 | 15.9 | 17.2 | 16.5 | 17.1 | 30 |
| 160 | ABERDEEN HIGH SCHOOL | 16.7 | 30.0 | 16.0 | 16.5 | 16.2 | 17.4 | 76 |
| 161 | DURANT HIGH SCHOOL | 16.7 | 30.0 | 15.5 | 16.2 | 16.4 | 18.1 | 23 |
| 162 | LEAKE CENTRAL HIGH SCHOOL | 16.6 | 30.0 | 15.2 | 16.3 | 16.7 | 17.5 | 109 |
| 163 | PERRY CENTRAL HIGH SCHOOL | 16.5 | 30.0 | 15.7 | 16.4 | 16.9 | 17.1 | 71 |
| 164 | SOUTH PIKE HIGH SCHOOL | 16.5 | 30.0 | 14.6 | 17.0 | 16.8 | 17.0 | 104 |
| 165 | VELMA JACKSON MAGNET SCHOOL | 16.5 | 30.0 | 15.3 | 16.4 | 15.5 | 17.9 | 57 |
| 166 | SIMMONS HIGH SCHOOL | 16.5 | 30.0 | 14.9 | 17.1 | 16.2 | 17.1 | 35 |
| 167 | MAGEE HIGH SCHOOL | 16.4 | 24.0 | 15.1 | 16.9 | 16.5 | 16.9 | 105 |
| 168 | RALEIGH HIGH SCHOOL | 16.4 | 24.0 | 14.7 | 16.7 | 16.8 | 17.1 | 103 |
| 169 | MORTON HIGH SCHOOL | 16.4 | 24.0 | 15.5 | 16.4 | 16.3 | 17.1 | 81 |
| 170 | YAZOO COUNTY HIGH SCHOOL | 16.4 | 24.0 | 15.2 | 16.3 | 16.2 | 17.2 | 117 |
| 171 | OBANNON HIGH SCHOOL | 16.4 | 24.0 | 15.6 | 16.0 | 15.9 | 17.6 | 65 |
| 172 | SOUTH DELTA HIGH SCHOOL | 16.4 | 24.0 | 15.4 | 16.2 | 16.0 | 17.5 | 54 |
| 173 | MCCOMB HIGH SCHOOL | 16.3 | 24.0 | 15.0 | 16.7 | 16.3 | 16.9 | 152 |
| 174 | BASSFIELD JR SR HIGH SCHOOL | 16.3 | 24.0 | 15.1 | 17.3 | 15.9 | 16.6 | 50 |
| 175 | COLLINS HIGH SCHOOL | 16.3 | 24.0 | 15.8 | 16.9 | 15.5 | 16.6 | 65 |
| 176 | VICKSBURG HIGH SCHOOL | 16.3 | 24.0 | 14.8 | 16.0 | 16.6 | 17.0 | 233 |
| 177 | ASHLAND HIGH SCHOOL | 16.3 | 24.0 | 15.1 | 16.9 | 15.1 | 17.7 | 55 |
| 178 | H W BYERS HIGH SCHOOL | 16.2 | 24.0 | 14.8 | 16.3 | 16.4 | 17.0 | 45 |
| 179 | HOLLY SPRINGS HIGH SCHOOL | 16.2 | 24.0 | 15.6 | 15.9 | 15.7 | 17.0 | 97 |
| 180 | LOUISVILLE HIGH SCHOOL | 16.2 | 24.0 | 14.9 | 16.6 | 15.9 | 16.8 | 108 |
| 181 | WEST POINT HIGH SCHOOL | 16.2 | 24.0 | 14.0 | 16.6 | 16.5 | 16.9 | 220 |
| 182 | MOUNT OLIVE ATTENDANCE CENTER | 16.2 | 24.0 | 14.6 | 16.6 | 16.0 | 17.0 | 32 |
| 183 | MONTGOMERY COUNTY HIGH SCHOOL | 16.2 | 24.0 | 15.1 | 15.9 | 16.5 | 16.3 | 20 |
| 184 | SALEM ATTENDANCE CENTER | 16.1 | 24.0 | 14.3 | 16.3 | 16.1 | 17.2 | 31 |
| 185 | KEMPER COUNTY HIGH SCHOOL | 16.1 | 24.0 | 14.7 | 15.8 | 16.2 | 17.1 | 88 |
| 186 | SHANNON HIGH SCHOOL | 16.0 | 24.0 | 13.8 | 16.4 | 16.3 | 16.9 | 115 |
| 187 | ROSA FORT HIGH SCHOOL | 16.0 | 24.0 | 14.4 | 16.2 | 15.7 | 17.2 | 131 |
| 188 | BYHALIA HIGH SCHOOL | 15.9 | 24.0 | 14.7 | 15.5 | 15.9 | 17.1 | 102 |
| 189 | COLUMBUS HIGH SCHOOL | 15.9 | 24.0 | 14.1 | 16.3 | 15.8 | 17.0 | 226 |
| 190 | MOSS POINT HIGH SCHOOL | 15.9 | 24.0 | 14.9 | 15.7 | 15.9 | 16.9 | 128 |
| 191 | JOHN F KENNEDY MEMORIAL HIGH SCHOOL | 15.9 | 24.0 | 14.6 | 15.7 | 16.3 | 16.6 | 29 |
| 192 | MENDENHALL HIGH SCHOOL | 15.9 | 24.0 | 14.5 | 16.2 | 15.9 | 16.2 | 114 |
| 193 | FOREST HIGH SCHOOL | 15.9 | 24.0 | 14.1 | 16.3 | 15.6 | 16.8 | 93 |
| 194 | BAY SPRINGS HIGH SCHOOL | 15.8 | 24.0 | 13.9 | 16.5 | 15.7 | 16.7 | 62 |
| 195 | JIM HILL HIGH SCHOOL | 15.8 | 24.0 | 14.7 | 15.8 | 15.6 | 16.7 | 251 |
| 196 | GREENWOOD HIGH SCHOOL | 15.8 | 24.0 | 14.6 | 16.2 | 15.5 | 16.3 | 158 |
| 197 | LAUREL HIGH SCHOOL | 15.8 | 24.0 | 14.7 | 16.1 | 15.3 | 16.4 | 190 |
| 198 | HUMPHREYS COUNTY HIGH | 15.7 | 24.0 | 14.1 | 16.0 | 15.1 | 17.0 | 111 |
| 199 | TYLERTOWN HIGH SCHOOL | 15.7 | 24.0 | 14.4 | 16.0 | 15.2 | 16.7 | 99 |
| 200 | HEIDELBERG HIGH SCHOOL | 15.6 | 24.0 | 13.8 | 15.9 | 15.7 | 16.5 | 74 |
| 201 | BROAD STREET HIGH SCHOOL | 15.6 | 24.0 | 14.6 | 15.4 | 15.7 | 16.3 | 35 |
| 202 | GENTRY HIGH SCHOOL | 15.6 | 24.0 | 14.2 | 16.0 | 14.9 | 16.4 | 139 |
| 203 | RULEVILLE CENTRAL HIGH | 15.5 | 24.0 | 14.3 | 15.9 | 15.4 | 16.3 | 95 |
| 204 | HATTIESBURG HIGH SCHOOL | 15.5 | 24.0 | 14.1 | 16.0 | 15.2 | 16.1 | 200 |
| 205 | HAZLEHURST HIGH SCHOOL | 15.5 | 24.0 | 14.2 | 15.8 | 15.1 | 16.2 | 81 |
| 206 | WILKINSON COUNTY HIGH | 15.5 | 24.0 | 13.4 | 16.4 | 15.0 | 16.6 | 67 |
| 207 | SHAW HIGH SCHOOL | 15.4 | 18.0 | 13.9 | 15.7 | 16.0 | 15.7 | 38 |
| 208 | CRYSTAL SPRINGS HIGH | 15.4 | 18.0 | 13.9 | 15.8 | 15.3 | 16.1 | 104 |
| 209 | OKOLONA HIGH SCHOOL | 15.3 | 18.0 | 13.6 | 16.1 | 15.0 | 16.0 | 43 |
| 210 | WEST TALLAHATCHIE HIGH | 15.3 | 18.0 | 13.3 | 15.8 | 15.1 | 17.0 | 50 |
| 211 | LEAKE COUNTY HIGH SCHOOL | 15.3 | 18.0 | 13.9 | 14.7 | 15.7 | 16.1 | 38 |
| 212 | PRENTISS HIGH SCHOOL | 15.3 | 18.0 | 13.1 | 15.8 | 15.6 | 16.4 | 47 |
| 213 | GREENVILLE HIGH SCHOOL | 15.2 | 18.0 | 13.7 | 15.7 | 15.2 | 15.9 | 287 |
| 214 | NORTH PANOLA HIGH SCHOOL | 15.2 | 18.0 | 13.7 | 16.2 | 14.3 | 16.2 | 73 |
| 215 | PORT GIBSON HIGH SCHOOL | 15.2 | 18.0 | 13.6 | 15.4 | 15.6 | 15.5 | 83 |
| 216 | CANTON HIGH SCHOOL | 15.2 | 18.0 | 13.6 | 15.7 | 15.0 | 16.0 | 160 |
| 217 | RAY BROOKS SCHOOL | 15.2 | 18.0 | 12.7 | 15.9 | 14.1 | 17.6 | 12 |
| 218 | JEFFERSON COUNTY HIGH | 15.2 | 18.0 | 14.0 | 15.5 | 15.0 | 15.6 | 91 |
| 219 | NATCHEZ HIGH SCHOOL | 15.1 | 18.0 | 14.0 | 15.3 | 15.0 | 15.6 | 175 |
| 220 | CLARKSDALE HIGH SCHOOL | 15.1 | 18.0 | 13.7 | 15.1 | 15.1 | 15.7 | 146 |
| 221 | EAST SIDE HIGH SCHOOL | 15.1 | 18.0 | 13.5 | 15.5 | 14.3 | 16.5 | 81 |
| 222 | FOREST HILL HIGH SCHOOL | 15.1 | 18.0 | 13.9 | 15.5 | 14.7 | 15.5 | 208 |
| 223 | MADISON S PALMER HIGH | 15.1 | 18.0 | 13.6 | 15.5 | 14.6 | 16.2 | 80 |
| 224 | CHARLESTON HIGH SCHOOL | 15.0 | 18.0 | 13.0 | 15.4 | 15.0 | 16.3 | 82 |
| 225 | LELAND HIGH SCHOOL | 15.0 | 18.0 | 14.0 | 15.3 | 14.6 | 15.8 | 47 |
| 226 | PROVINE HIGH SCHOOL | 15.0 | 18.0 | 13.6 | 15.4 | 14.7 | 15.9 | 220 |
| 227 | COAHOMA COUNTY HIGH | 14.9 | 18.0 | 13.5 | 15.5 | 15.3 | 15.1 | 66 |
| 228 | YAZOO CITY HIGH SCHOOL | 14.9 | 18.0 | 14.0 | 15.1 | 15.3 | 14.7 | 101 |
| 229 | ROBERT M CALLAWAY HIGH SCHOOL | 14.9 | 18.0 | 13.6 | 15.3 | 14.6 | 15.7 | 217 |
| 230 | HOLMES COUNTY CENTRAL HIGH SCHOOL | 14.8 | 18.0 | 13.1 | 15.3 | 14.6 | 15.7 | 185 |
| 231 | COAHOMA AGRICULTURAL HIGH SCHOOL | 14.8 | 18.0 | 13.3 | 15.3 | 14.4 | 15.8 | 63 |
| 232 | WEST LOWNDES HIGH SCHOOL | 14.8 | 18.0 | 12.7 | 15.2 | 14.4 | 16.4 | 42 |
| 233 | NEWTON HIGH SCHOOL | 14.8 | 18.0 | 13.3 | 15.7 | 14.9 | 14.7 | 56 |
| 234 | RANKIN COUNTY LEARNIN CENTER | 14.8 | 18.0 | 11.2 | 15.3 | 15.1 | 16.8 | 12 |
| 235 | NOXUBEE COUNTY HIGH SCHOOL | 14.7 | 18.0 | 13.3 | 15.0 | 14.8 | 15.4 | 133 |
| 236 | LANIER HIGH SCHOOL | 14.7 | 18.0 | 13.1 | 15.2 | 14.5 | 15.5 | 137 |
| 237 | WEST BOLIVAR DISTRICT HIGH SCHOOL | 14.6 | 18.0 | 13.6 | 15.2 | 14.1 | 15.4 | 56 |
| 238 | COLDWATER ATTENDANCE CENTER | 14.5 | 18.0 | 12.8 | 15.1 | 13.9 | 15.1 | 34 |
| 239 | LEFLORE COUNTY HIGH | 14.5 | 18.0 | 13.0 | 14.7 | 14.1 | 15.8 | 68 |
| 240 | AMANDA ELZY HIGH SCHOOL | 14.4 | 12.0 | 13.1 | 14.8 | 14.1 | 15.3 | 84 |
| 241 | WINGFIELD HIGH SCHOOL | 13.9 | 12.0 | 11.9 | 14.7 | 13.9 | 14.8 | 136 |

For the full datasets referenced in this article:
- ACT Results of Mississippi Juniors 2016, Mississippi Department of Education
- ACT Profile Report for Mississippi 2016, ACT, Inc.
- The Condition of College and Career Readiness 2016, ACT, Inc.

Leave A Comment