What do we know about Nebraska’s Class of 2019? They are overwhelmingly white, and only slightly less prepared for college than their peers nationwide. Their college-readiness, as determined by their ACT scores, is directly correlated with their socio-economic status. And when they do go to college, many opt to stay in the familiar surroundings of the Cornhusker State.
In the 2019 graduating class, 24,744 Nebraska students took the ACT; their mean composite score was a 20.0 out of a possible 36. For comparison, 2018’s graduating class had about 200 fewer students and scored slightly higher, with a mean composite of 20.1. Nationally, the average composite score was a 20.7 (also down from last year’s mean composite of 20.8).
In 2017, the ACT became compulsory—and free—for all Nebraska high school juniors; this requirement means that Nebraska’s data is remarkably complete. In 2019, it was one of 15 states where an estimated 100% of graduates took the ACT. Among these, only Utah and Wisconsin scored higher, both of which scored an average composite of 20.3. (Nevada ranked lowest with an average of 17.9.)
States with higher testing levels tend to have lower average scores, since they include results from students whose future plans may not include college-level coursework. In states where standardized testing like the ACT is optional, most of the test-takers are a self-selecting, academically advanced group of students. For example, consider Connecticut and Massachusetts, which had the highest average ACT scores in the nation (25.5), but only tested 22% and 21% of graduates, respectively.
ACT Benchmark Scores Measure College Readiness
The ACT’s “College Readiness Benchmarks” are the scores (out of 36) on the subject area tests that indicate a student’s chances of college success. The ACT believes that meeting the benchmarks for English, Reading, Mathematics, and Science gives a student a 50% chance of earning a B or higher or a 75% chance of getting a C or higher in a corresponding freshman-level college course. Unchanged since 2013, these benchmark scores and their college course equivalents are:
- English (English Composition) – 18
- Reading (Social Sciences) – 22
- Math (College Algebra) – 22
- Science (Biology) – 23
Since 2015, the ACT has also offered a College Readiness Benchmark for coursework in STEM (science, technology, engineering, and math), based on scores on the Math & Science subject area tests. Because college-level STEM coursework tends to be more academically challenging (for instance, many STEM freshmen begin with Calculus instead of Algebra), ACT has determined that the benchmark ACT score is significantly higher for STEM than in other subject areas. Meeting the STEM benchmark indicates a 50% chance of earning a B or higher in identified college-level STEM courses. The benchmark score is:
- Math & Science (STEM) – 26
Many Nebraska Juniors are Not Prepared for College
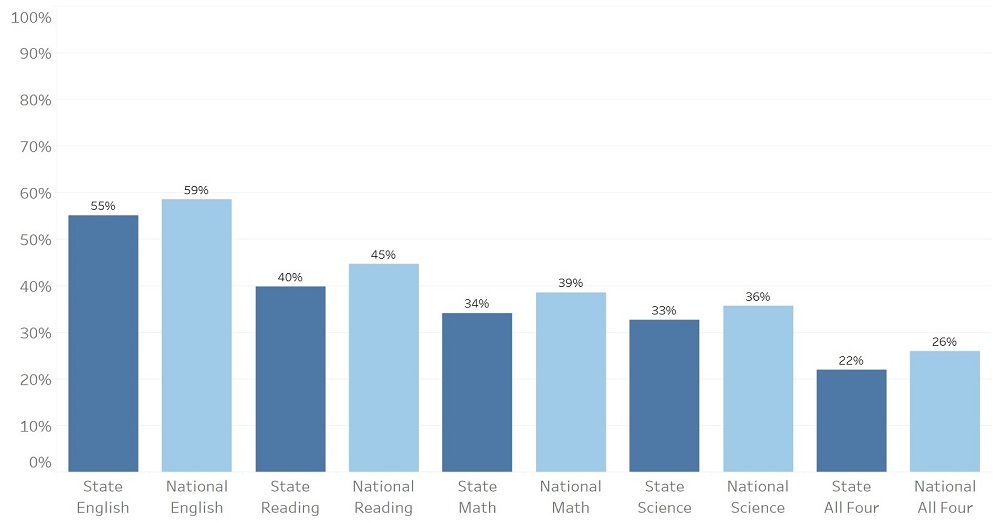
Percent of Nebraska Students (dark blue) Compared to the Nation (light blue) Meeting College Benchmarks (ACT Inc.)
A slim majority of Nebraska’s graduates (55%) are prepared for college English, the only subject area in which more than half of test-takers surpassed the benchmark score. 40% of students met the Reading benchmark, and about one-third of graduates are college-ready in Math and Science. Only 16% of students achieved ACT scores which showed college readiness for STEM. In all subject areas, Nebraskans’ scores trail the national average, but by no more than 5%.
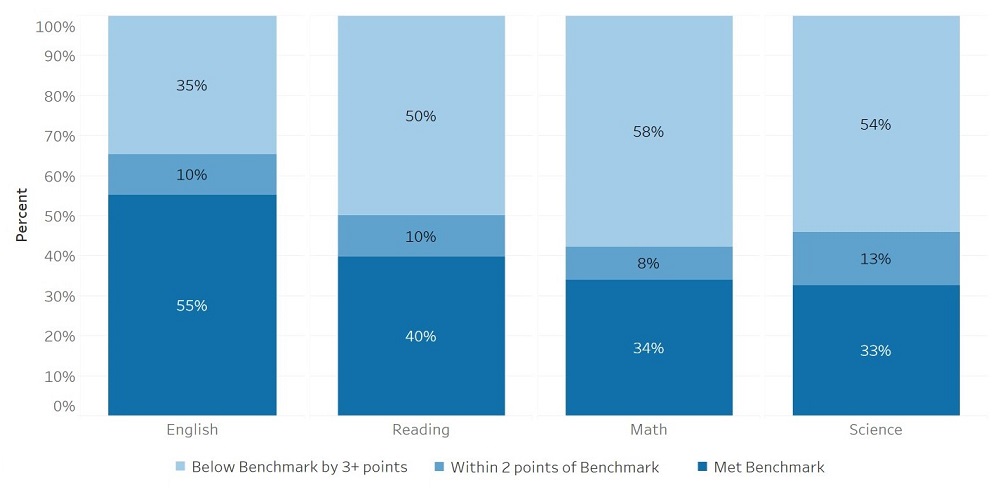
Breakdown of 2019 Nebraska Graduates by College Benchmark Attainment (ACT Inc.)
Compared to the class of 2018, this set of graduates showed about the same level of college preparedness across the board. The average scores of 2019 students stayed the same in English, declined by 0.1 points in Reading and Math, and increased by 0.1 points in Science.
Although these numbers show room for improvement, there is one statistic which offers some hope. In 2019 in every subject area besides math, at least 10% of the graduates who didn’t meet the benchmarks were within 2 points of doing so. If just these students’ scores could be brought up to benchmark levels, Nebraska would surpass national averages in all four testing areas.
Racial Disparities are Evident in Nebraska’s ACT Scores
Sadly, one of the biggest indicators of ACT success is one over which students have no control: their racial background. Nationally, Asian Americans have the highest rates of success, followed by white students. Students who identify as Black or African American score the lowest, just behind students with American Indian heritage. (Students who identify as either Hispanic or Pacific Islander score somewhere in the middle.)
These nationwide trends are mirrored in Nebraska’s 2019 results. 42% of white students and 38% of Asian students met three or more College Readiness Benchmarks, but only 9% of Black students and 14% of Latino graduates did so. The significance of these results is skewed somewhat by the racial makeup of the graduating class:
- White – 63%
- Hispanic/Latino – 15%
- Black/African American – 5%
- Asian – 3%
In other words, Nebraska could close the achievement gap by raising the scores of only 420 Black students, and just over 1,000 Hispanic students.
Poverty Levels Directly Affect ACT Scores
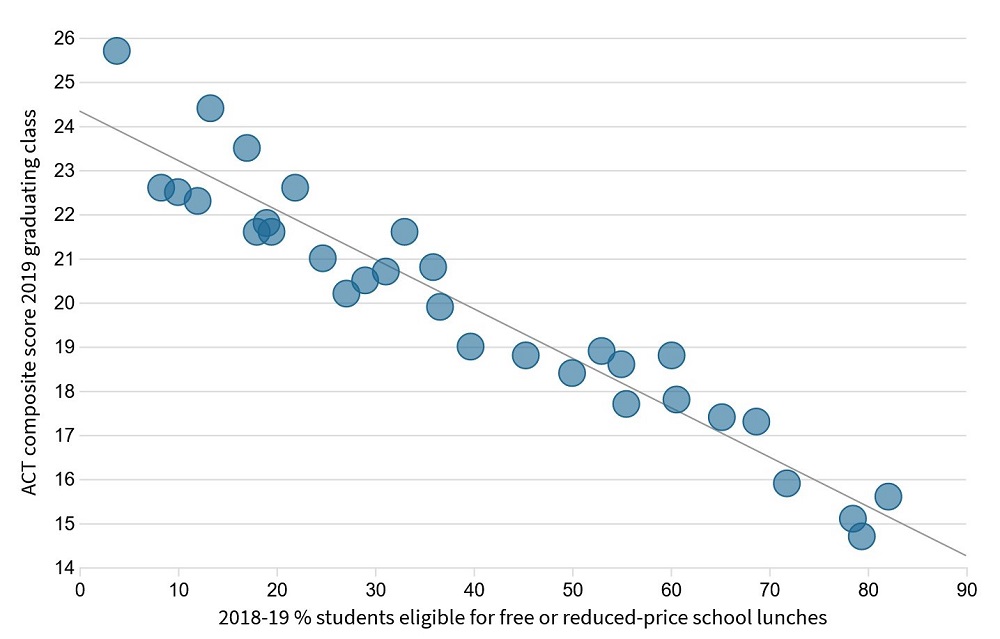
Average ACT Composite Score vs. Poverty Rate of 31 Nebraska High Schools (Omaha World-Herald)
Along with race, one of the biggest predictors of ACT success is socio-economic status. In a survey of ACT results from 31 Nebraska high schools, there was a direct correlation between a school’s average composite score and its poverty rate, as determined by the percentage of its students who were eligible for free or reduced-price school lunches.
According to this survey, the five top-scoring Omaha-area high schools (and their reported average scores) were:
- Elkhorn South High School (25.7)
- Elkhorn High School (24.4.)
- Millard North High School (23.5)
- Millard West High School (22.6)
- Gretna High School (22.5)
In all five schools, fewer than 20% of students were eligible for free or reduced-price school lunches.
Students Can Improve Their ACT Scores
Luckily for students looking to increase their chances of ACT success, there are several actions they can take which are statistically likely to improve their scores.
- Focus on schoolwork and take academically challenging classes. Students who do better in school nearly always do better overall on standardized tests like the ACT. For example, in 2019, Nebraska students who had taken three or more years of high school math scored an average of more than 5 points higher (20.7) on the ACT Math test than those who had not (15.6).
- Take the ACT more than once. There is a clear statistical advantage to retesting; in 2019, the average composite score of Nebraska graduates who took the ACT two or more times was 22.9, more than 5 points higher than the average composite score (17.3) of students who took the test only once. Students worried about the cost of retesting should consider ACT’s fee waiver program, which allows eligible students to test for free.
- Spend time studying and preparing specifically for the ACT. Taking practice tests helps students familiarize themselves with the content and the format of the test and gives them specific feedback. In addition, working with a tutor can be an effective way of improving a student’s weakest areas and developing test-taking strategies. Piqosity offers a full suite of free ACT Practice materials, perfect for students looking to increase their chances of ACT success.
Nebraska’s Colleges are Accessible and Affordable
76% of Nebraska’s 2019 graduates aspire to postsecondary education, with the majority aiming for a four-year bachelor’s degree. There’s good news for parents worried about becoming empty-nesters: students sent more than half of their ACT score reports to public in-state colleges.
The top five colleges among test-takers were:
- University of Nebraska – Lincoln
- University of Nebraska – Omaha
- University of Nebraska – Kearney
- Wayne State College
- Metropolitan Community College – NE
Being admitted to these schools is an attainable goal. At all locations of the University of Nebraska, for instance, a first-year applicant will be guaranteed admission if they score at least a 20 composite on the ACT. (As a reminder, that was the average score in 2019.) They are also considered good value colleges, with total costs for in-state students averaging $20,000 yearly (before financial aid). In fact, UN Lincoln was one of only 20 public universities labeled a “Best Buy” by the 2018 Fiske Guide.
Top Nebraska High Schools by ACT Scores
Nebraska high school students are tested, typically during their junior year, using the Nebraska Student-Centered Assessment System (NSCAS ACT). They are graded along three metrics: English Language Arts (ELA), the average of the English, Reading, and Writing tests; Mathematics; and Science. Of the 240 public high schools for which data was available, 100 had a composite score of 20.0 or over.
Top 10 Nebraska Public High Schools by 2019 Average ACT Scores (composite)
1. Mead High School (24.4)
1. Elkhorn South High School (24.3)
2. Osmond High School (22.8)
3. Elkhorn High School (22.7)
3. Giltner High School (22.7)
4. Millard North High School (22.6)
4. Wynot High School (22.6)
5. Centennial Jr./Sr. High School (22.4)
5. Plainview Secondary School (22.4)
5. Ponca High School (22.4)
How to Read This Sortable Table
- The default sort is by composite score from highest to lowest; to change the sorting order, click on the header by which you want to sort
- “Avg Score” is the composite ACT score from 0 to 36
- “ELA, Math, Science” refers to the school’s average scores in each subject area from 0 to 36
- “# Tested” is the number of students who sat for the exam at each school
| wdt_ID | SCHOOL | AVG Score | ELA | Math | Science | # Tested |
|---|---|---|---|---|---|---|
| 1 | MEAD HIGH SCHOOL | 24.40 | 23.80 | 23.50 | 24.10 | 13 |
| 2 | ELKHORN SOUTH HIGH SCHOOL | 24.30 | 22.60 | 23.90 | 23.60 | 299 |
| 3 | OSMOND HIGH SCHOOL | 22.80 | 21.80 | 22.70 | 22.30 | 20 |
| 4 | ELKHORN HIGH SCHOOL | 22.70 | 21.90 | 22.50 | 22.10 | 303 |
| 5 | GILTNER HIGH SCHOOL | 22.70 | 22.10 | 23.20 | 21.90 | 15 |
| 6 | MILLARD NORTH HIGH SCHOOL | 22.60 | 21.40 | 22.10 | 22.60 | 633 |
| 7 | WYNOT HIGH SCHOOL | 22.60 | 21.30 | 22.80 | 23.10 | 12 |
| 8 | CENTENNIAL JR-SR HIGH SCHOOL | 22.40 | 22.50 | 21.90 | 21.80 | 33 |
| 9 | PLAINVIEW SECONDARY SCHOOL | 22.40 | 20.50 | 23.60 | 22.50 | 19 |
| 10 | PONCA HIGH SCHOOL | 22.40 | 22.20 | 21.80 | 22.00 | 36 |
| 11 | BLOOMFIELD JR-SR HIGH SCHOOL | 22.40 | 20.20 | 22.90 | 23.30 | 13 |
| 12 | MC PHERSON COUNTY SECONDARY SCHOOL | 22.40 | 23.50 | 20.50 | 21.60 | 11 |
| 13 | STUART HIGH SCHOOL | 22.30 | 20.80 | 21.40 | 22.70 | 10 |
| 14 | ADAMS CENTRAL JR-SR HIGH SCH | 22.20 | 20.50 | 22.50 | 22.10 | 83 |
| 15 | KENESAW SECONDARY SCHOOL | 22.10 | 21.60 | 22.10 | 21.00 | 21 |
| 16 | MILLARD WEST HIGH SCHOOL | 22.10 | 20.90 | 21.30 | 22.00 | 589 |
| 17 | DILLER-ODELL SECONDARY SCHOOL | 22.10 | 21.80 | 23.90 | 21.10 | 20 |
| 18 | NORRIS HIGH SCHOOL | 22.00 | 20.10 | 20.70 | 21.70 | 166 |
| 19 | BENNINGTON HIGH SCHOOL | 21.90 | 21.10 | 21.60 | 21.70 | 149 |
| 20 | LAWRENCE/NELSON HIGH SCH | 21.90 | 20.40 | 21.00 | 21.90 | 17 |
| 21 | LINCOLN EAST HIGH SCHOOL | 21.80 | 19.50 | 20.80 | 20.70 | 533 |
| 22 | BRUNING-DAVENPORT HIGH SCHOOL | 21.80 | 19.70 | 22.50 | 20.80 | 11 |
| 23 | YUTAN HIGH SCHOOL | 21.80 | 22.20 | 21.30 | 21.50 | 38 |
| 24 | NORTH BEND CENTRAL HIGH SCHOOL | 21.70 | 20.40 | 21.10 | 21.50 | 41 |
| 25 | MEDICINE VALLEY JR-SR HIGH SCHOOL | 21.70 | 19.20 | 22.20 | 21.70 | 13 |
| SCHOOL | AVG Score | ELA | Math | Science | # Tested |
For the full datasets referenced in this article:
- The Condition of College and Career Readiness 2019: Nebraska Key Findings, ACT, Inc.
- The Condition of College and Career Readiness 2019, ACT, Inc.
- Nebraska 2019 ACT Composite Scores, Nebraska Department of Education
- Nebraska 2019 ACT Assessment Data – All Subjects, Nebraska Department of Education

[…] [2] Top Nebraska High Schools by ACT Scores – Piqosity – Adaptive Learning & Student Man… […]