It has a sad name, but Alabama’s Loveless High School edges out Mountainbrook and Vestavia in claiming the title of Alabama’s Best High School for ACT results. Definitively determining which are the “best” high schools requires a detailed assessment along many metrics. Of those, one important factor to consider is standardized test scores; since the top high schools are those which adequately prepare their students for college or a career, it makes sense that those schools should also have the highest ACT scores. (ACT scores are often a reliable indicator of college- and career-readiness.) This article looks at general trends in Alabama’s 2020 ACT scores with a focus on the top high schools across the state.
In the 2020 graduating class, 55,658 Alabama students took the ACT; their mean composite score was an 18.8 out of a possible 36. This is about 1,500 fewer students than 2019’s graduating class, which scored a slightly higher mean composite of 18.9. Nationally, the average composite score in 2020 was 20.6 (again, down slightly from 2019’s mean composite of 20.7).
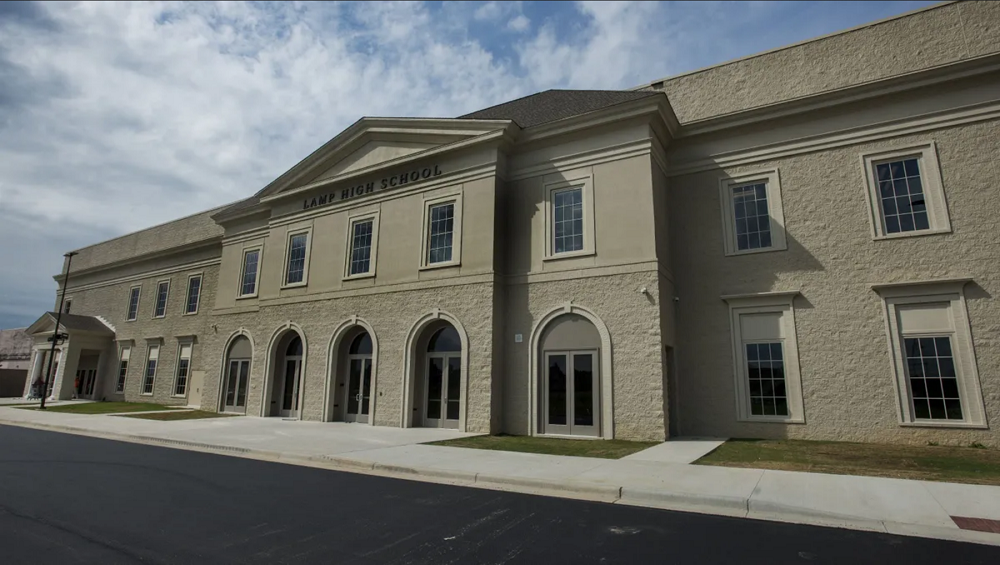
(Top image caption—Loveless Academic Magnet Program (LAMP) High School has some of Alabama’s highest average ACT scores)
Since 2015, Alabama has administered the ACT to all high school juniors; this requirement means that the state’s data is remarkably complete. In 2020, it was one of 15 states where an estimated 100% of graduates took the ACT; among these, it ranked eighth (tied with North Carolina). Of the states with 100% participation, Utah had the highest average score (20.2) and Nevada had the lowest (17.9).
It’s worth noting that in general, states with higher testing levels tend to have lower average scores. One main reason for this is that they include results from students whose future plans may not include college-level coursework. In states where standardized testing like the ACT is optional, test-takers are primarily a self-selecting, academically advanced cohort, which is reflected in their test scores. Consider, for example, Massachusetts, which had 2020’s highest average ACT scores in the nation (26.0), but administered tests to only 18% of graduates.
ACT College Readiness Benchmarks for High School Seniors
The ACT’s “College Readiness Benchmarks” are the scores (out of 36) on the subject area tests that indicate a student’s chances of college success. The ACT believes that meeting the benchmarks for English, Reading, Mathematics, and Science gives a student a 50% chance of earning a B or higher or a 75% chance of getting a C or higher in a corresponding freshman-level college course. Unchanged since 2013, these benchmark scores and their college course equivalents are:
- English (English Composition) – 18
- Reading (Social Sciences) – 22
- Math (College Algebra) – 22
- Science (Biology) – 23
Since 2015, the ACT has also offered a College Readiness Benchmark for coursework in STEM (science, technology, engineering, and math), based on scores on the Math & Science subject area tests. Because college-level STEM coursework tends to be more academically challenging (for instance, many STEM freshmen begin with Calculus instead of Algebra), ACT has determined that the benchmark ACT score is significantly higher for STEM than in other subject areas. Meeting the STEM benchmark indicates a 50% chance of earning a B or higher in identified college-level STEM courses. The benchmark score is:
- Math & Science (STEM) – 26
Half of Alabama High School Juniors are Not College-Ready
Dispiritingly, Alabama’s Class of 2020 lags behind the national average for students meeting ACT College Readiness Benchmarks (CRBs) by at least 10% in all subject areas. Alabama’s students are most college-ready in English, but even there, only about half (48%) of graduates met the CRB. The numbers are significantly lower in other subject areas: only one third of students (33%) met the Reading benchmark, and less than a fourth are college-ready in Math (22%) and Science (24%).
2020’s results follow a long-term trend of gradually decreasing college-readiness among Alabama students. Just under 50% of graduates failed to meet college benchmarks in all subject areas, up over 1.5% from last year (and up over 4% since 2017). Interestingly, the number of students who show college-readiness in all three or more subject areas has slightly increased over the same period, suggesting that Alabama is experiencing a widening achievement gap rather than an overall downturn in ACT performance.
There is one piece of better news: Alabama seniors have demonstrated improvement in Science college-readiness. The percentage of graduates meeting the Science benchmark rose 0.7% from 2019, from 23.6% to 24.3%. This is a small improvement, but an encouraging one nonetheless.
Alabama’s Racial & Economic Achievement Gaps
Nationally, there is a concerning correlation between a student’s racial background and their likelihood of. In general, Asian Americans have the highest rates of success, followed by white students. Students who identify as Black or African American score the lowest (Hispanic students, and students of other races, score somewhere in the middle.) It is important to emphasize that this is not a causative relationship. Black students do not score worse than white students, on average, because they are Black; rather, it is that many factors which negatively impact ACT scores tend to disproportionately affect non-white (and non-Asian) students.
Alabama’s 2020 results reveal a similar racial achievement gap. While 57% of Asian students and 34% of white students met three or more College Readiness Benchmarks, only 6% of Black graduates and 15% of Latinos did so. The continuing underperformance by Black students is particularly concerning because they make up a significant percentage of Alabama’s senior class: Black students comprise 27%. (The largest group, white students, makes up 54%; the mostly high-achieving Asian students make up less than 2% of graduates). To put it in terms of concrete numbers, if Alabama wanted to close the achievement gap between white and Black graduates, they would need to improve the scores of around 4,300 Black students.
In addition to a student’s race, their economic status is often closely related to their ACT performance. Nationwide, the achievement gap between students whose family income is less than $36,000 a year (classified as “low income”) and those whose family income exceeds that amount is very wide: when comparing students who meet 3 or more CRBs, over 20 percentage points separate the two groups.
In Alabama this gap is somewhat smaller—just under 17 percentage points—but of great concern is the fact that only 11% of low-income students are meeting 3 or more CRBs. (This is about three times less than the achievement rate of students who do not come from a low-income background.)
How to Improve ACT Scores
Luckily for students of all racial and economic backgrounds looking to increase their chances of ACT success, there are several actions they can take which are statistically likely to improve their scores.
- Focus on schoolwork and take academically challenging classes. Students who do better in school nearly always do better overall on standardized tests like the ACT. For instance, 2020 Alabama seniors who took a full four years of English scored an average of 5.5 points better on the English ACT than those who had taken less than four years of English classes.
- Take the ACT more than once. There is a clear statistical advantage to retesting; in 2020, the average composite score of Alabama students who took the ACT two or more times was 21.8, nearly 6 points higher than the average composite score (16) of those who took the test only once. Students worried about the cost of retesting should consider ACT’s fee waiver program, which allows eligible students to test for free.
- Spend time studying and preparing specifically for the ACT. Taking practice tests helps students familiarize themselves with the content and the format of the test and gives them specific feedback. In addition, working with a tutor can be an effective way of improving a student’s weakest areas and developing test-taking strategies. Piqosity offers a full suite of free ACT Practice materials and analyses of previously-released ACT tests, perfect for students wondering how to improve their ACT scores.
Alabama’s Colleges are Popular and Affordable
A majority (63%) of 2020 Alabama graduates aspire to a minimum of a four-year bachelor’s degree. (Note: about 25% of Alabama’s 2020 Senior Class did not indicate their post-secondary educational plans.) If these college-bound students are anything like their peers in previous years, a majority likely want to remain within the borders of the Heart of Dixie. Seniors in 2019, for instance, sent nearly 70% of their ACT score reports to public in-state colleges; their top five selections were:
- Auburn University
- University of Alabama
- University of Alabama – Birmingham
- Troy University
- University of South Alabama
Admission to these schools is fairly competitive, but still attainable. For instance, a 2019 analysis of the average ACT scores of accepted students at Alabama colleges found that students could expect to be admitted to Troy University with an ACT Composite Score of 21. (For reference, in 2019 a majority of students at 29 Alabama high schools met this benchmark).
Students looking for a slightly lower benchmark might consider Alabama State University or Alabama A&M University, both of which generally admit applicants with an ACT Composite Score of 18 or higher. (A majority of graduates from 182 high schools met this benchmark.)
What’s more, Alabama colleges are well within the financial reach of many students—for instance, all of the five schools listed above rank within the Top 10 Most Affordable Colleges at which to obtain a bachelor’s degree.
Best High Schools in Alabama by ACT Scores
Due to the impact of COVID-19, the U.S. Department of Education issued a waiver to Alabama on March 27, 2020 waiving the requirement of reporting accountability results for the 2019-2020 school year. Consequently, the following table uses data from 2019, the last year for which complete information was available. (Two schools each tied for 5th and 8th place. See subject scores breakdown for further delineation.)
Top 10 Alabama High Schools by 2019 Average ACT Scores (composite)
1. Loveless Academic Magnet Program High School (29.4)
2. Mountain Brook High School (27.4)
3. Vestavia Hills High School (25.3)
4. Homewood High School (24.2)
5. Spain Park High School (23.7)
5. Bob Jones High School (23.7)
6. Oak Mountain High School (23.6)
7. James Clemens High School (23.5)
8. Huntsville High School (23.4)
8. New Century Technology High School (23.4)
How to Read This Sortable Table
- The default sort is by composite score from highest to lowest; to change the sorting order, click on the header by which you want to sort
- “Avg Score” is the composite ACT score from 0 to 36
- “English, Reading, Math, Science” refers to the school’s average scores in each subject test from 0 to 36
Alabama ACT Scores 2019
| wdt_ID | School | Avg Score | English | Reading | Math | Science |
|---|---|---|---|---|---|---|
| 1 | Loveless Academic Magnet Program High School | 29.4 | 31.9 | 30.4 | 28.1 | 29.0 |
| 2 | Mountain Brook High School | 27.4 | 28.3 | 27.4 | 27.1 | 27.5 |
| 3 | Vestavia Hills High School | 25.3 | 26.3 | 26.3 | 24.6 | 25.5 |
| 4 | Homewood High School | 24.2 | 24.8 | 25.2 | 23.7 | 24.3 |
| 5 | Bob Jones High School | 23.7 | 24.2 | 24.8 | 23.3 | 23.9 |
| 6 | Spain Park High School | 23.7 | 24.3 | 23.7 | 22.8 | 23.8 |
| 7 | Oak Mountain High School | 23.6 | 24.5 | 23.6 | 22.9 | 23.7 |
| 8 | James Clemens High School | 23.5 | 24.6 | 24.5 | 22.9 | 23.5 |
| 9 | Huntsville High School | 23.4 | 24.1 | 24.7 | 22.5 | 23.8 |
| 10 | New Century Technology High School | 23.4 | 23.9 | 23.4 | 21.9 | 23.9 |
| 11 | Booker T Washington Magnet High School | 22.8 | 24.6 | 25.0 | 20.6 | 22.6 |
| 12 | Fairhope High School | 22.7 | 23.0 | 24.3 | 22.0 | 23.1 |
| 13 | Hewitt-Trussville High School | 22.7 | 23.7 | 23.9 | 21.8 | 23.1 |
| 14 | Hoover High School | 22.7 | 23.3 | 23.5 | 22.0 | 23.1 |
| 15 | Arab High School | 22.4 | 22.7 | 23.8 | 21.2 | 22.9 |
| 16 | Auburn High School | 22.4 | 22.5 | 23.5 | 22.3 | 22.6 |
| 17 | Hartselle High School | 22.2 | 22.9 | 23.0 | 21.7 | 22.5 |
| 18 | Northridge High School | 22.2 | 22.6 | 22.2 | 21.6 | 22.3 |
| 19 | Helena High School | 22.0 | 22.7 | 23.2 | 21.2 | 22.4 |
| 20 | Brewbaker Technology Magnet High School | 21.9 | 23.3 | 23.5 | 20.3 | 22.2 |
| 21 | Cullman High School | 21.9 | 22.2 | 23.3 | 21.2 | 22.4 |
| 22 | Baldwin County Virtual School | 21.7 | 21.9 | 23.5 | 19.7 | 21.9 |
| 23 | Spanish Fort High School | 21.7 | 22.2 | 21.7 | 20.2 | 22.2 |
| 24 | Virgil Grissom High School | 21.7 | 21.8 | 23.2 | 20.7 | 21.9 |
| 25 | Muscle Shoals High School | 21.6 | 22.5 | 21.6 | 21.3 | 21.3 |
| School | Avg Score | English | Reading | Math | Science |
Get Prepared for the ACT with Piqosity
- Download free official ACT practice tests and review our answers explanations
- Register for a free Piqosity account to access our 10 full-length ACT practice tests
For the full datasets referenced in this article:

Leave A Comment