A high school’s average ACT scores can reveal a lot—they are usually a reliable indicator of college- and career-readiness, and the best high schools are those which adequately prepare their students for college or a career. If you’re wondering which are the best Utah high schools, then, it’s a good idea to look at the ones with the best ACT scores! Read on to find out which ones they are—this article examines general trends in Utah’s 2020 ACT scores with a focus on the top-scoring high schools across the state.
Utah’s Class of 2020 was the largest on record, including 44,446 students who took the ACT. They scored a mean composite of 20.2 out of a possible 36. For reference, 2019’s graduating class had about 700 fewer students and scored marginally higher, with a mean composite of 20.3. Nationally, the average composite score in 2020 was 20.6 (down slightly from 2019’s mean composite of 20.7).
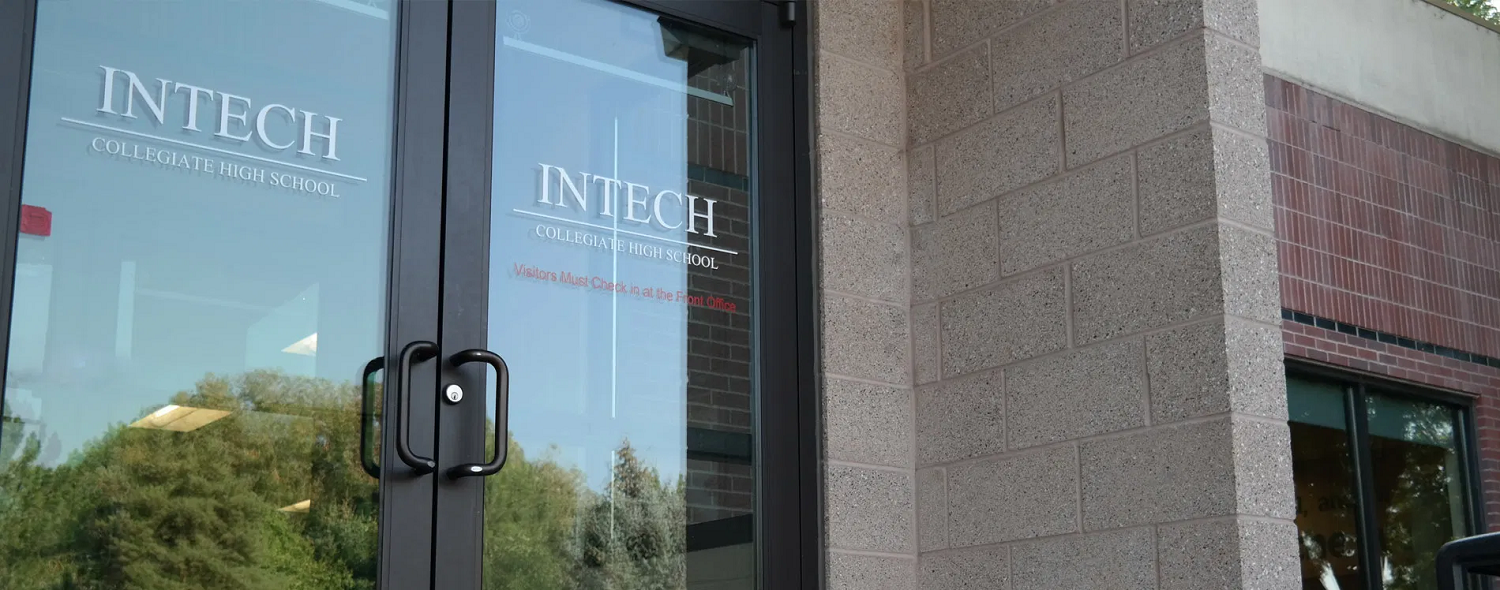
(Top image caption—InTech Collegiate High School in North Logan has Utah’s highest average ACT scores)
Since 2013, Utah has administered the ACT to all high school juniors Consequently, the state’s data gives a remarkably full picture of its students’ aptitude and progress. In 2020, Utah was one of 15 states where an estimated 100% of graduates took the ACT; among these, it had the highest average. (The lowest scores—an average of 17.9—came from neighboring Nevada.)
Utah Scores in Context
To get a true sense of what Utah’s scores mean, it’s useful to have some context. In general, states with higher testing levels tend to have lower average scores. This is shown in the graph below, which plots the average scores of all 50 states (and the District of Columbia) against the percentage of graduates who were tested.
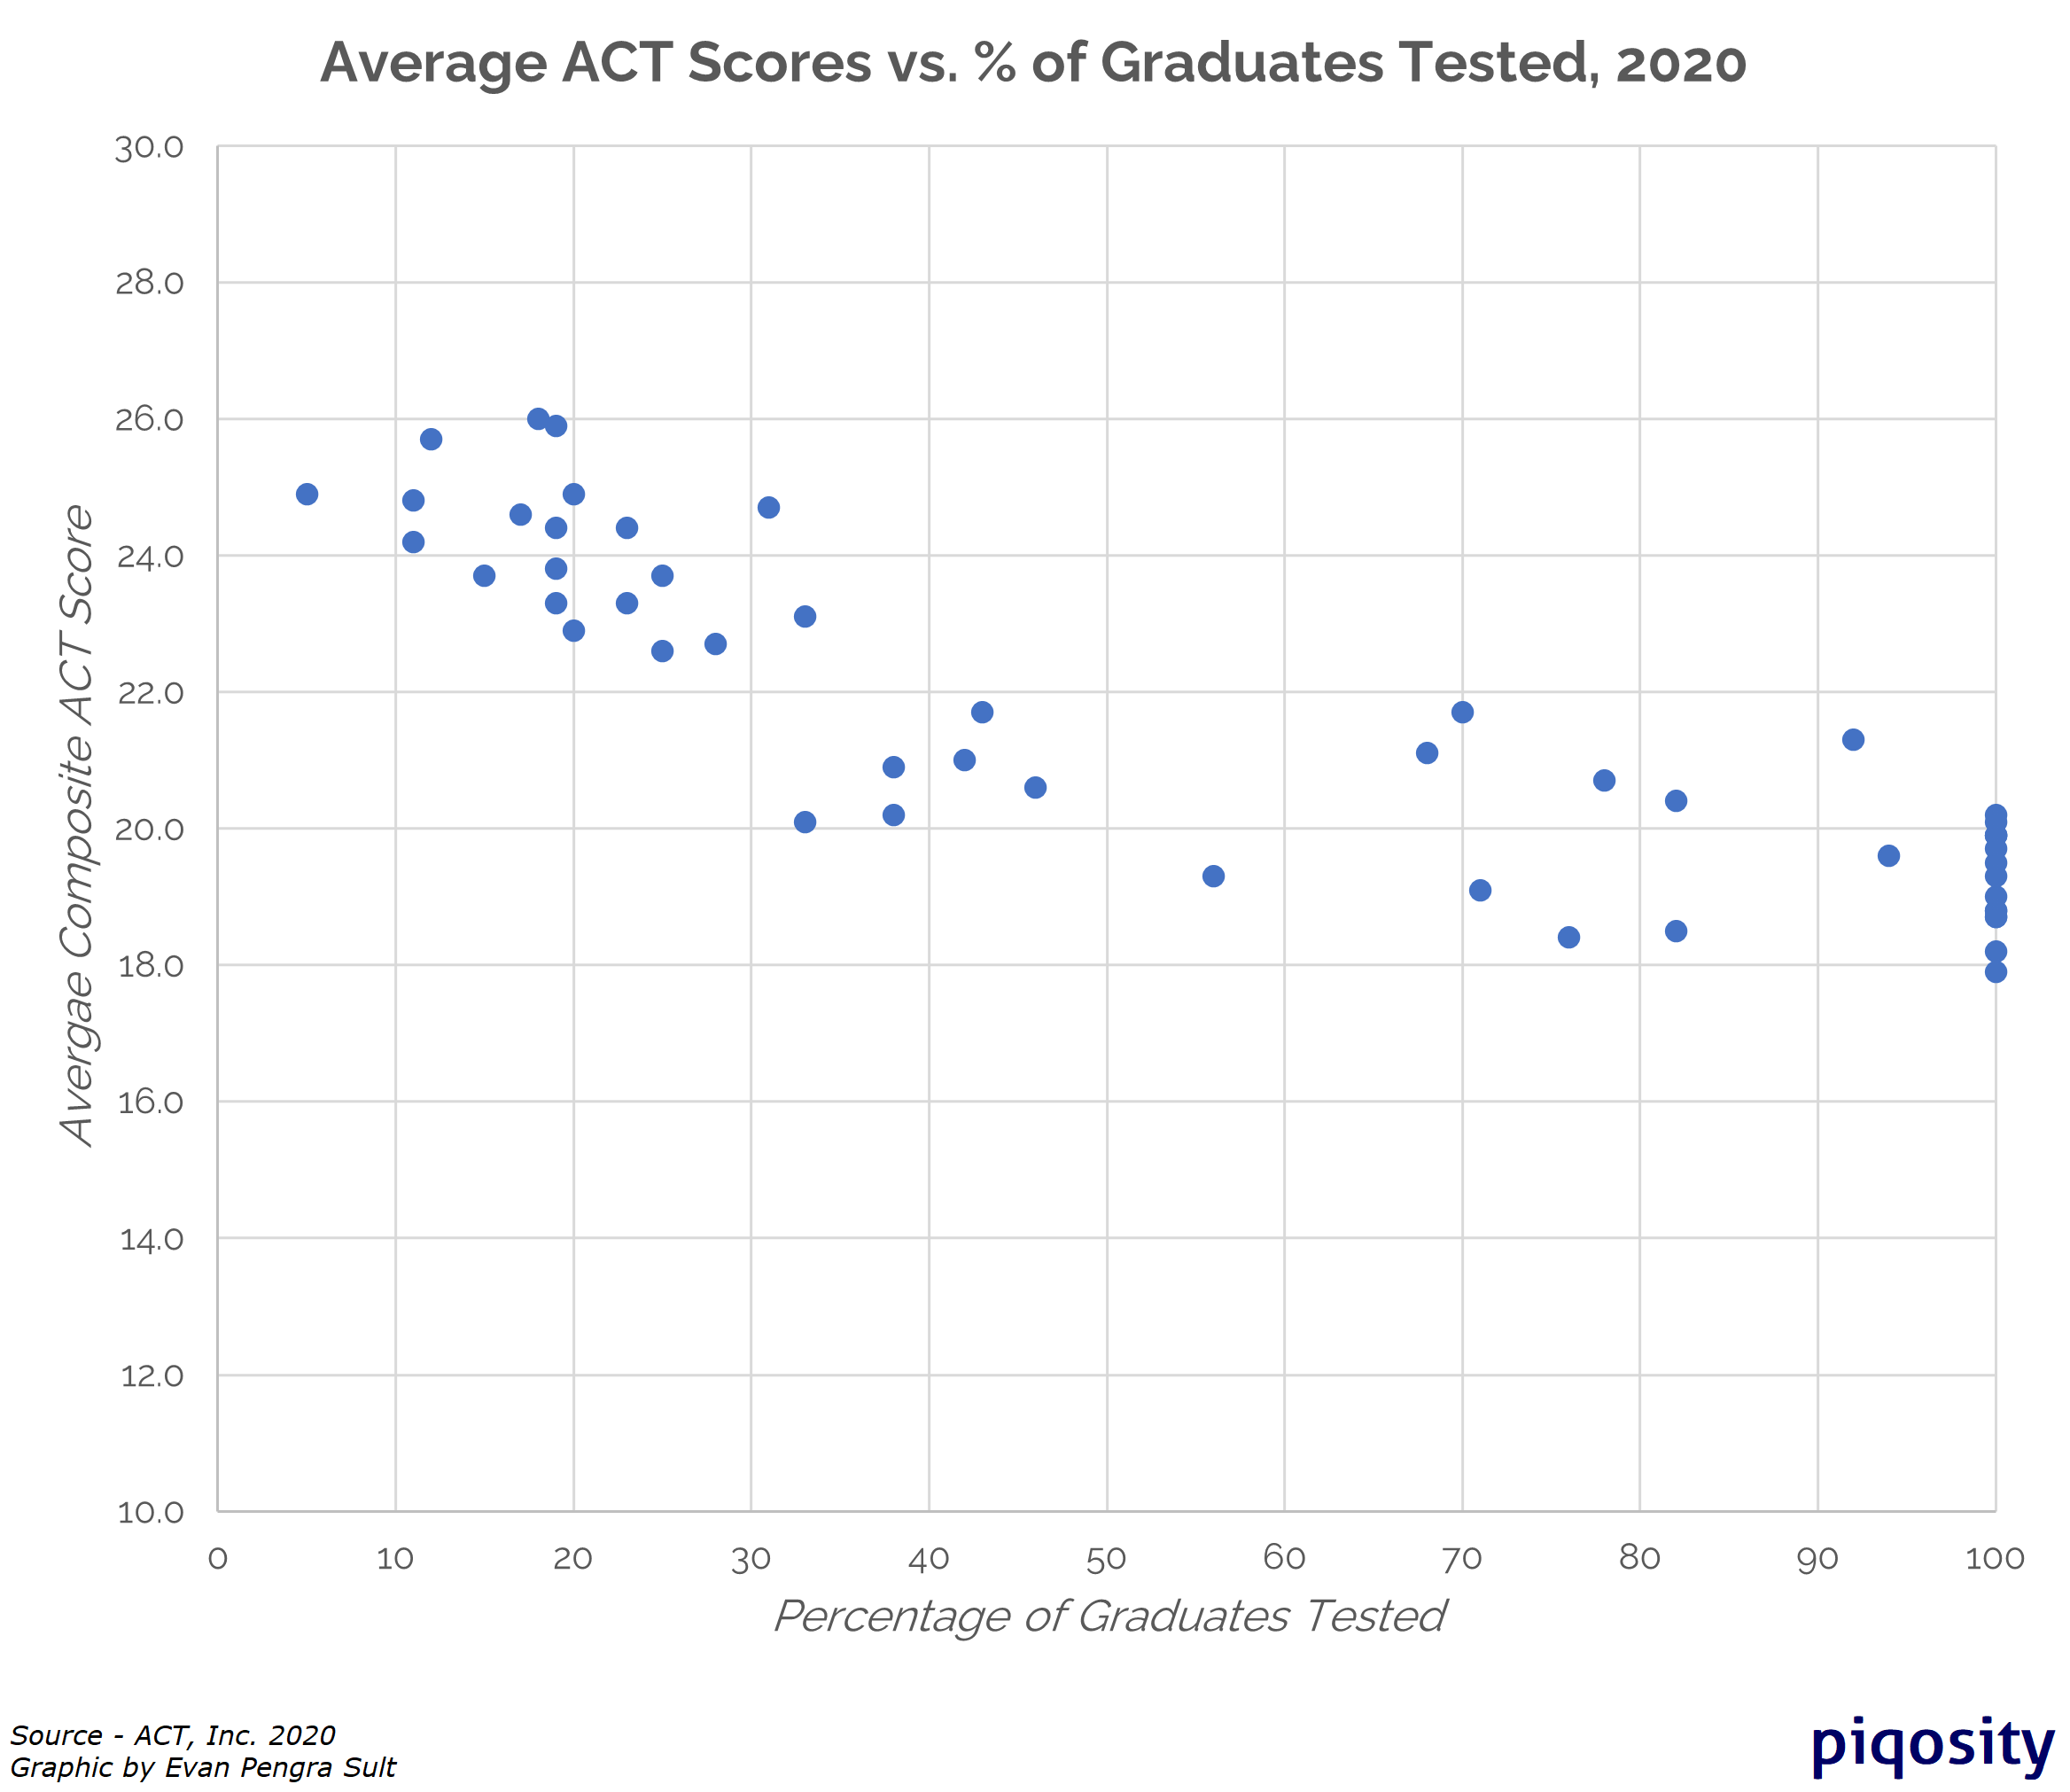
Although the data is not perfectly linear (real-life data rarely is), there is a clear correlation between higher levels of testing and lower average scores. One main reason for this is that they include results from students whose future plans may not include college-level coursework. (In some cases, these students will “take” the test but not actually complete it, resulting in artificially low scores). In states where standardized testing like the ACT is optional, test-takers are primarily a self-selecting, academically advanced cohort, which is reflected in their test scores.
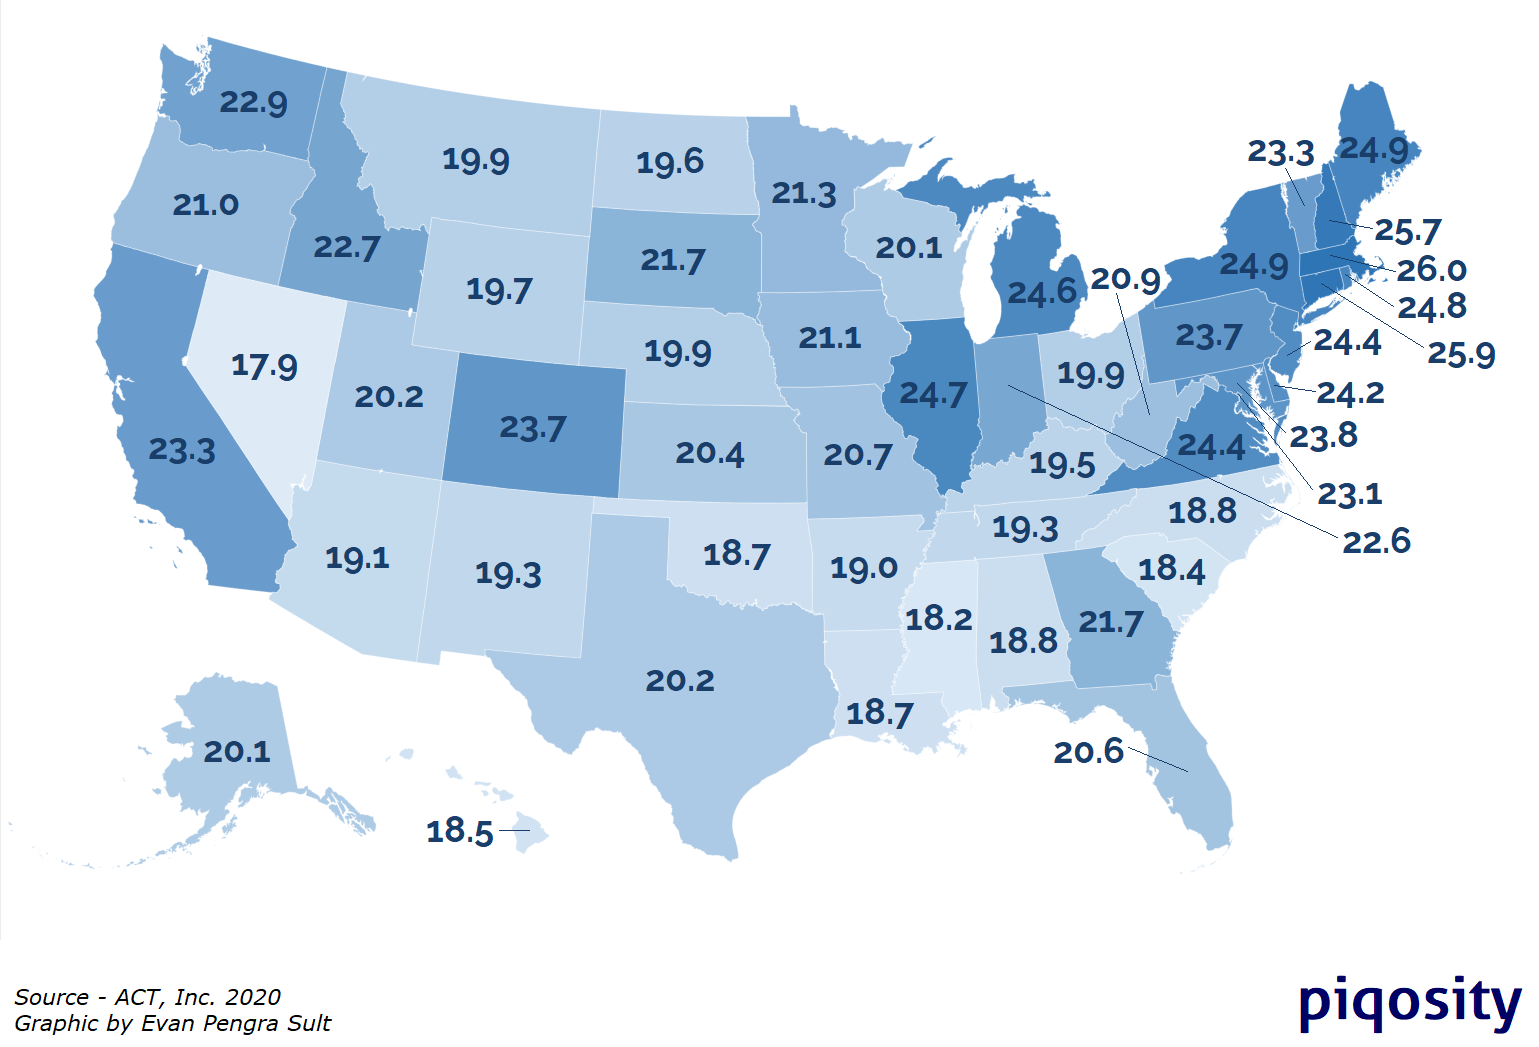
But taking this into account, Utah’s results actually look even more impressive. Not only did Utah outpace the 14 other states who tested 100% of graduates, it scored higher than an additional 14 states whose average scores reflect a smaller portion of their graduating class. Particularly noteworthy is the fact that Utah outranked Alaska and equaled Texas, both of which tested only around one-third of students. (This can be seen in the map below—darker shades indicate higher scores.)
ACT College Readiness Benchmarks
The ACT’s “College Readiness Benchmarks” are the scores (out of 36) on the subject area tests that indicate a student’s chances of college success. The ACT believes that meeting the benchmarks for English, Reading, Mathematics, and Science gives a student a 50% chance of earning a B or higher or a 75% chance of getting a C or higher in a corresponding freshman-level college course. Unchanged since 2013, these benchmark scores and their college course equivalents are:
- English (English Composition) – 18
- Reading (Social Sciences) – 22
- Math (College Algebra) – 22
- Science (Biology) – 23
Since 2015, the ACT has also offered a College Readiness Benchmark for coursework in STEM (science, technology, engineering, and math), based on scores on the Math & Science subject area tests. Because college-level STEM coursework tends to be more academically challenging (for instance, many STEM freshmen begin with Calculus instead of Algebra), ACT has determined that the benchmark ACT score is significantly higher for STEM than in other subject areas. Meeting the STEM benchmark indicates a 50% chance of earning a B or higher in identified college-level STEM courses. The benchmark score is:
- Math & Science (STEM) – 26
Are Utah Juniors College-Ready?
As we’ve noted above, Utah’s scores are particularly impressive when you consider that they reflect the entirety of the Class of 2020, not just a self-selecting cohort. This continues to hold true when comparing Utah to the national average for students meeting ACT College Readiness Benchmarks (CRBs). Although Utah’s numbers slightly trail the nation’s, the gap is never wider than 3 percentage points, as seen in the chart below.
Still, just because Utah is nearly keeping pace with the national average doesn’t mean that there’s no room for growth. These results indicate that more than half of Utahns are not ready for college-level coursework in Reading, Math, or Science, which should not be a point of pride.
Let’s put it in terms of concrete numbers. If Utah wanted to raise its rates of college readiness to at least 50% in all categories (a good goal, even if still not the desired end point), it would need to improve the Reading scores of about 2,600 students and the Math and Science scores of about 7,100 students.
This may seem like a lot of work, but it’s a more attainable goal than you might think. For instance, nearly 3,000 Utah students were within 1 point of meeting the Reading CRB—raising the scores of that cohort alone would put the numbers over 50%. (The gap is wider when considering Math and Science scores.)
Utah’s Racial & Economic Achievement Gaps
Nationally, there is a concerning correlation between a student’s racial background and their likelihood of ACT success. In general, Asian Americans have the highest rates of success, followed by white students. Students who identify as Black or African American score the lowest (Hispanic students, and students of other races, generally score somewhere in the middle.) It is important to emphasize that this is not a causative relationship. Black students do not score worse than white students, on average, because they are Black; rather, it is that many factors which negatively impact ACT scores tend to disproportionately affect non-white (and non-Asian) students.
At first glance, Utah’s 2020 results reveal a similar racial achievement gap, but with a few important caveats. First, Utahns are overwhelmingly white (65%), and the second-largest group are Hispanic students (16%). Thus, the most useful comparison is between these two groups. Here, indeed, Utah’s results follow the national trend: 43% of white students met 3 or more College Readiness Benchmarks, while only 15% of Hispanic students did so.
Closing this achievement gap will take effort, but it’s not an insurmountable challenge. If Utah wanted to achieve parity in college readiness between white and Hispanic students, they would only need to improve the scores of just under 2,000 Black students.
In addition to race, a student’s economic status is often closely related to their ACT performance. Nationwide, the achievement gap between students whose family income is less than $36,000 a year (classified as “low income”) and those whose family income exceeds that amount is very wide: when comparing students who meet 3 or more CRBs, over 20 percentage points separate the two groups. In Utah, this gap is slightly smaller—around 18 percentage points—but there is clearly still room for improvement.
How to Improve ACT Scores
Luckily for students of all racial and economic backgrounds looking to increase their chances of ACT success, there are several actions they can take which are statistically likely to improve their scores.
- Focus on schoolwork and take academically challenging classes. Students who do better in school nearly always do better overall on standardized tests like the ACT. For instance, 52% of 2020 Utah seniors who took the “Core” curriculum (four years of English and three years each of mathematics, social studies, and natural sciences) met 3 or more CRBs, while only 24% of seniors who did not meet “Core” standards did so.
- Take the ACT more than once. There is a clear statistical advantage to retesting; in 2020, Utah students who took the ACT two or more times had an average composite score 6.2 points higher than those who took the test only once. Students worried about the cost of retesting should consider ACT’s fee waiver program, which allows eligible students to test for free.
- Spend time studying and preparing specifically for the ACT. Taking practice tests helps students familiarize themselves with the content and the format of the test and gives them specific feedback. In addition, working with a tutor can be an effective way of improving a student’s weakest areas and developing test-taking strategies. Piqosity offers a full suite of free ACT Practice materials and analyses of previously-released ACT tests, perfect for students wondering how to improve their ACT scores.
Utah’s Colleges are Popular and Affordable
A slim majority (54%) of 2020 Utah graduates aspire to a minimum of a four-year bachelor’s degree. This number is probably not a wholly true representation of Utahns’ college plans, since about 38% of students declined to indicate their post-secondary educational plans. (If we consider the proportion of college-bound students as a portion of those who actually responded, the figure is an impressive 87%. The “real” answer is probably somewhere in the middle.)
One thing we can say for sure about these college-bound seniors is that most of them are planning to remain within the borders of the Beehive State. 2020 Seniors sent an overwhelming majority (nearly 80%) of their ACT score reports to in-state colleges; their top five selections were:
- University of Utah
- Utah Valley University
- Utah State University
- Dixie State University
- Weber State University
While high ACT scores make any student an attractive candidate, all of these five except Dixie State University will consider students for admission without test scores. (Some require ACT scores if students wish to be considered for academic scholarships, and may also use ACT scores to help determine class placement.)
Historically, the average ACT score of admitted students at these schools is in the low-mid 20s. (At University of Utah, for instance, it’s a 26, while at Weber State it’s a 21.) Admittedly, this is somewhat above Utah’s 2020 average of 20.2, which might suggest that less than half of Utah graduates are likely to get into a popular state school. But it’s more useful to only consider the scores of those students who are actually planning to attend college, rather than the entire graduating class. Using this metric, the average score is a 22.7, well within the range needed for acceptance at most in-state schools.
Regardless of where students end up, Utah colleges are easily within the financial reach of many students. For instance, all of the five schools listed above rank within the Top 11 Most Affordable Colleges at which to obtain a bachelor’s degree (the yearly tuition of all five is under $10,000).
Best High Schools in Utah by ACT Scores
The following table presents data from 193 Utah high schools for which full data was available. Scores presented here are from then-11th graders who took the ACT in 2019 (most of whom then graduated as part of the Class of 2020). Three schools tied for 4th place, and two schools tied for 6th place. See subject scores breakdown for further delineation.
Top 10 Utah High Schools by 2020 Average ACT Scores (Composite)
- InTech Collegiate High School (26.6)
- Beehive Science and Technology Academy (24.8)
- Northern Utah Academy for Math, Engineering, and Science – Davis Campus (24.7)
- Success Academy at Southern Utah University (24.6)
- Utah County Academy of Science (24.6)
- Winter Sports School (24.6)
- Lake Powell High School (24.0)
- Karl G. Maeser Preparatory Academy (23.6)
- Success Academy at Dixie State University (23.6)
- Northern Utah Academy for Math, Engineering, and Science – North Campus (22.9)
How to Read This Sortable Table
- The default sort is by composite score from highest to lowest; to change the sorting order, click on the header by which you want to sort
- “Avg Score” is the composite ACT score from 0 to 36
- “English, Reading, Math, Science” refers to the school’s average scores in each subject test from 0 to 36
Utah ACT Scores 2020
| wdt_ID | School | Avg Score | English | Reading | Math | Science |
|---|---|---|---|---|---|---|
| 1 | InTech Collegiate High School | 26.6 | 25.3 | 26.8 | 27.3 | 26.2 |
| 2 | Beehive Science & Technology Academy | 24.8 | 23.4 | 24.9 | 26.1 | 24.0 |
| 3 | Northern Utah Academy for Math Engineering & Science (Davis) | 24.7 | 24.4 | 24.2 | 25.3 | 24.3 |
| 4 | Success Academy (Southern Utah University) | 24.6 | 22.8 | 25.4 | 25.0 | 24.8 |
| 5 | Utah County Academy of Science | 24.6 | 23.9 | 25.5 | 24.7 | 24.2 |
| 6 | Winter Sports School | 24.6 | 24.7 | 24.7 | 24.4 | 23.8 |
| 7 | Lake Powell High School | 24.0 | 24.0 | 33.0 | 16.0 | 21.0 |
| 8 | Karl G. Maeser Preparatory Academy | 23.6 | 23.2 | 24.4 | 23.8 | 22.6 |
| 9 | Success Academy (Dixie State University) | 23.6 | 22.3 | 24.6 | 23.5 | 23.6 |
| 10 | Northern Utah Academy for Math Engineering & Science (North) | 22.9 | 22.8 | 23.6 | 22.2 | 22.6 |
| 11 | Skyline High | 22.7 | 21.5 | 23.9 | 22.4 | 22.4 |
| 12 | Academy for Math Engineering & Science | 22.3 | 21.0 | 22.9 | 22.3 | 22.6 |
| 13 | Farmington High | 22.3 | 21.5 | 22.8 | 21.8 | 22.4 |
| 14 | Lone Peak High | 22.2 | 20.9 | 23.1 | 21.7 | 22.7 |
| 15 | Itineris Early College High | 22.1 | 21.0 | 22.5 | 21.8 | 22.1 |
| 16 | Davis High | 22.0 | 20.9 | 22.5 | 22.0 | 21.9 |
| 17 | Park City High | 21.9 | 20.9 | 22.9 | 21.0 | 22.3 |
| 18 | Corner Canyon High | 21.8 | 20.5 | 22.7 | 21.0 | 22.4 |
| 19 | Silver Summit Academy | 21.8 | 20.8 | 23.4 | 19.8 | 22.4 |
| 20 | Viewmont High | 21.6 | 21.6 | 22.4 | 20.9 | 21.0 |
| 21 | American Fork High | 21.5 | 21.1 | 22.2 | 20.6 | 21.5 |
| 22 | Morgan High | 21.5 | 21.1 | 21.9 | 20.9 | 21.5 |
| 23 | Timpview High | 21.5 | 20.4 | 22.4 | 21.3 | 21.4 |
| 24 | Brighton High | 21.4 | 19.9 | 22.8 | 20.6 | 22.0 |
| 25 | Weber Innovation High School | 21.4 | 20.4 | 23.1 | 19.7 | 21.9 |
| School | Avg Score | English | Reading | Math | Science |
Get Prepared for the ACT with Piqosity
- Download free official ACT practice tests and review our answers explanations
- Register for a free Piqosity account to access our 10 full-length ACT practice tests
For the full datasets referenced in this article:
- US High School Graduating Class Data, ACT, Inc.
- Average ACT Scores by State – Graduating Class of 2020, ACT, Inc.
- ACT Profile Report 2020 – Utah, ACT, Inc.
- ACT Grade 11 Data by School, 2018-2019, Utah State Board of Education

Leave A Comment