Students from InTech Collegiate High School in North Logan, UT had the highest average composite ACT score in Utah’s Class of 2022, a 24.9, securing their alma mater’s place in the nation’s 78th-percentile rank and at the top of this list of the best high schools in Utah. Not far behind Intech Collegiate are four other stellar schools that surpassed the national 75th-percentile, including Utah County Academy of Science (with an average composite score of 24.5) and Northern Utah Academy for Math Engineering & Science (with a score of 24.4).
Utah’s Class of 2022 included 43,125 students who took the ACT. They scored a mean composite of 19.9 out of a possible 36. For reference, 2020’s graduating class had about 1,300 more students and scored marginally higher, with a mean composite of 20.2. Nationally, the average composite score in 2022 was 19.8 (down from 2020’s mean composite of 20.6).
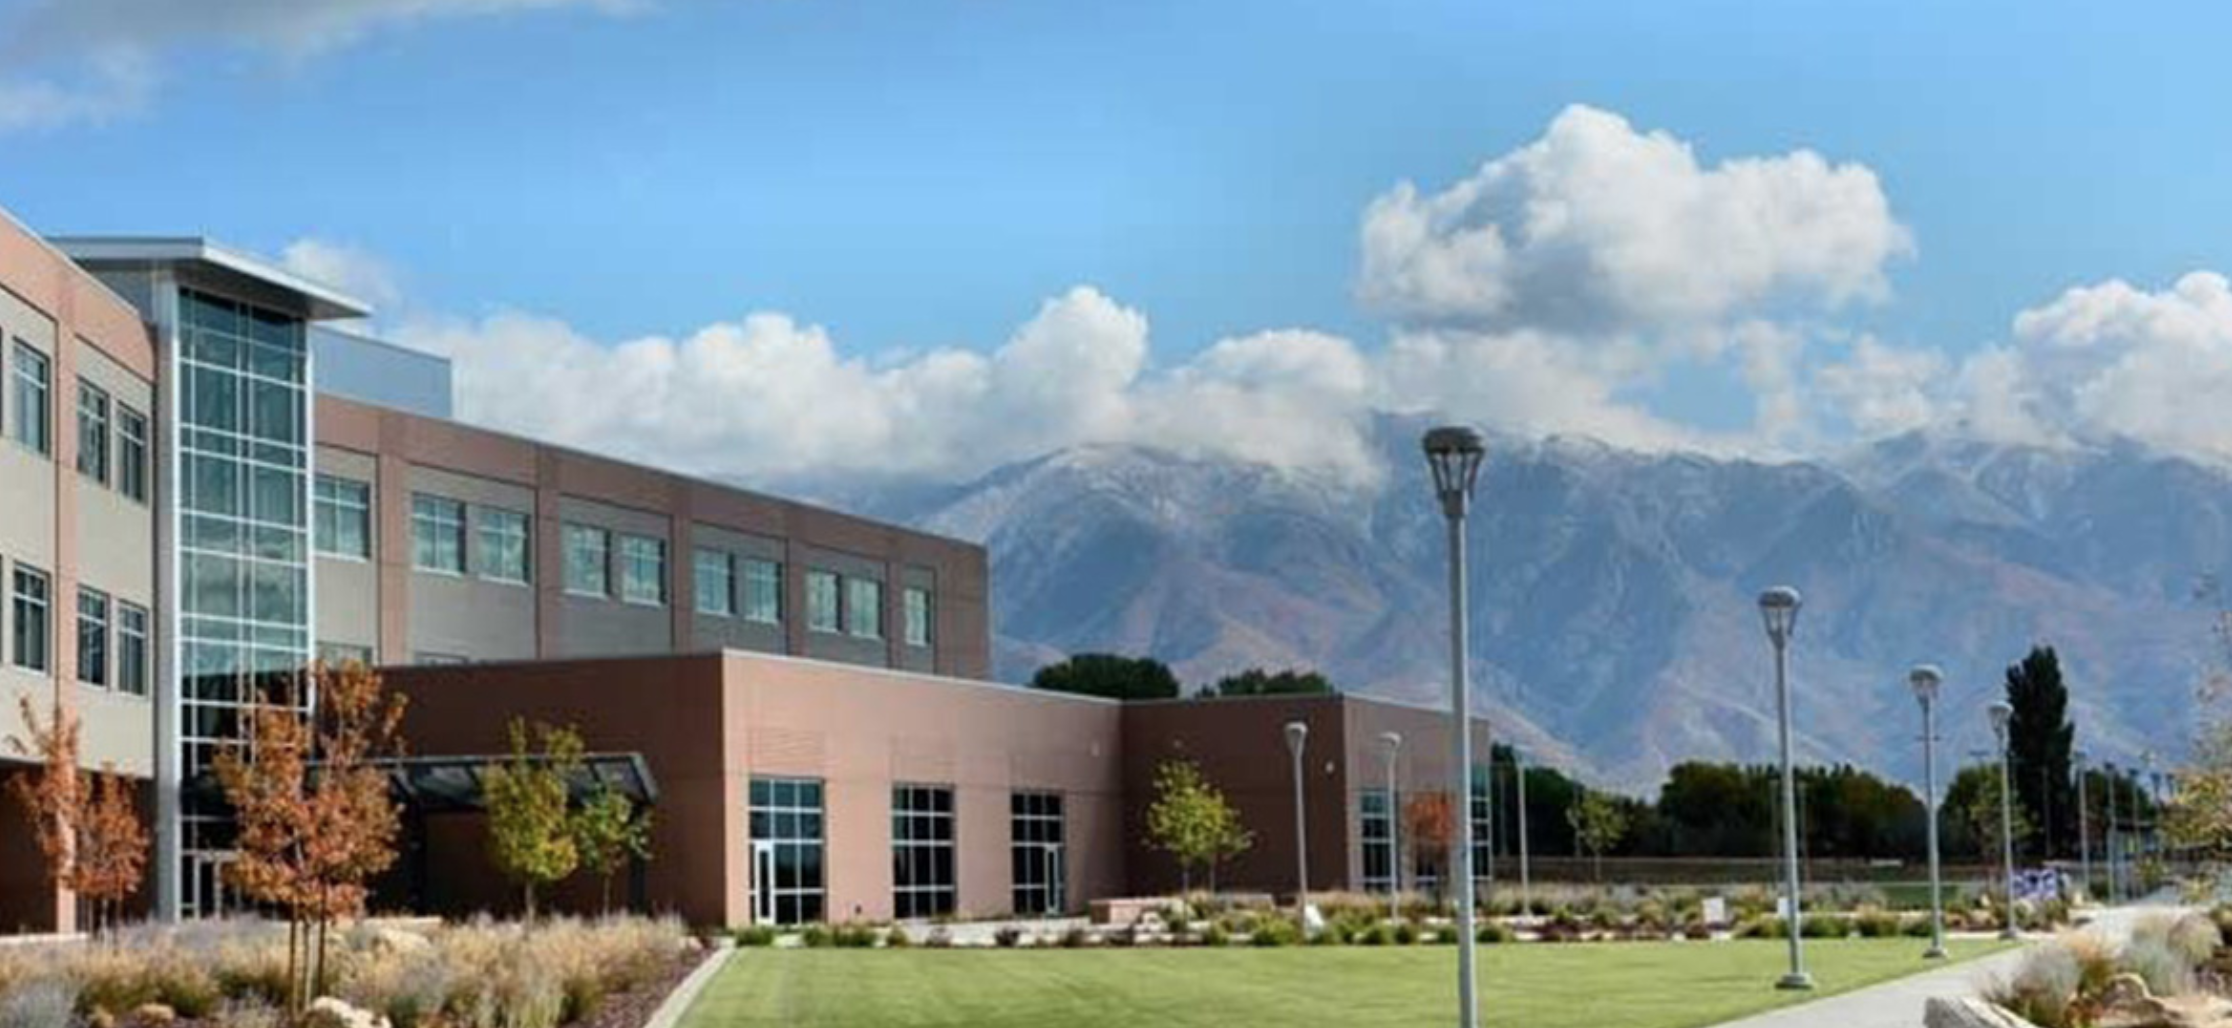
(Top image caption—Northern Utah Academy for Math, Engineering, and Science – Davis Campus has Utah’s third highest average ACT scores.)
A high school’s average ACT scores can reveal a lot—they are usually a reliable indicator of college- and career-readiness, and the best high schools are those which adequately prepare their students for college or a career. If you’re wondering which are the best Utah high schools, then, it’s a good idea to look at the ones with the best ACT scores! Read on to find out which ones they are—this article examines general trends in the Utah Class of 2022’s ACT scores with a focus on the best high schools across Utah according to their average ACT scores.
Utah Scores in Context
From 2013-2020, Utah had administered the ACT to all high school juniors; consequently, the state’s data gave a remarkably full picture of its students’ aptitude and progress. This streak stopped in 2021, when the state tested 86% of its juniors, no doubt due to the pandemic. In 2022, Utah tested 91% of its juniors—one of 10 states where between 80-99% of graduates took the ACT; among these, it had the highest average. (The lowest scores—an average of 17.9—came from Oklahoma.)
To get a true sense of what Utah’s scores mean, it’s useful to have some context. In general, states with higher testing levels tend to have lower average scores. This is shown in the graph below, which plots the average scores of all 50 states (and the District of Columbia) against the percentage of graduates who were tested.
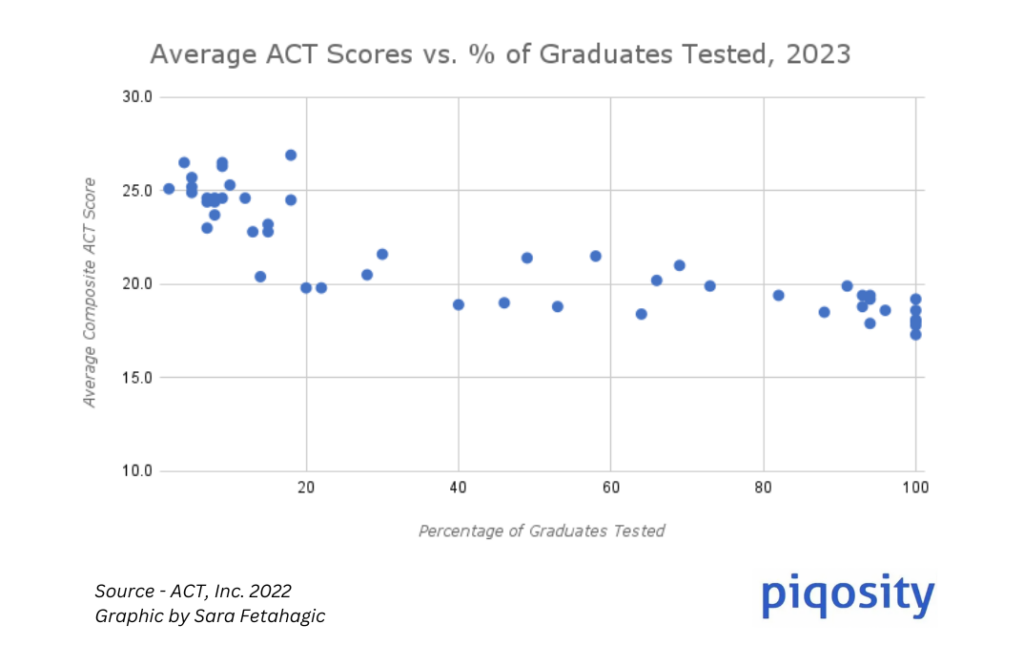
Although the data is not perfectly linear (real-life data rarely is), there is a clear correlation between higher levels of testing and lower average scores. One main reason for this is that they include results from students whose future plans may not include college-level coursework. (In some cases, these students will “take” the test but not actually complete it, resulting in artificially low scores).
In states where standardized testing like the ACT is optional, test-takers are primarily a self-selecting, academically advanced cohort, which is reflected in their test scores. For example, consider Washington D.C. and Massachusetts, which had the highest average ACT scores in the nation (26.9, 26.5), but only tested 18% and 9% of graduates, respectively.
But taking this into account, Utah’s results actually look even more impressive. Not only did Utah outpace the 10 other states who tested between 80% and 99% of graduates, it scored higher than an additional 7 states whose average scores reflect a smaller portion of their graduating class. Particularly noteworthy is the fact that Utah outranked Texas and New Mexico, both of which tested only around one-fifth of students.
ACT College Readiness Benchmarks
The ACT’s “College Readiness Benchmarks” are the scores (out of 36) on the subject area tests that indicate a student’s chances of college success. The ACT believes that meeting the benchmarks for English, Reading, Mathematics, and Science gives a student a 50% chance of earning a B or higher or a 75% chance of getting a C or higher in a corresponding freshman-level college course. Unchanged since 2013, these benchmark scores and their college course equivalents are:
- English (English Composition) – 18
- Reading (Social Sciences) – 22
- Math (College Algebra) – 22
- Science (Biology) – 23
Since 2015, the ACT has also offered a College Readiness Benchmark for coursework in STEM (science, technology, engineering, and math), based on scores on the Math & Science subject area tests. Because college-level STEM coursework tends to be more academically challenging (for instance, many STEM freshmen begin with Calculus instead of Algebra), ACT has determined that the benchmark ACT score is significantly higher for STEM than in other subject areas. Meeting the STEM benchmark indicates a 50% chance of earning a B or higher in identified college-level STEM courses. The benchmark score is: Math & Science (STEM) – 26
Are Utah Juniors College-Ready?
As we’ve noted above, Utah’s scores are particularly impressive when you consider that they reflect the majority of the Class of 2022, not just a self-selecting cohort. This continues to hold true when comparing Utah to the national average for students meeting ACT College Readiness Benchmarks (CRBs). Utah’s numbers slightly surpass the nation’s in each ACT subject CRB, minus being a single percentage point behind for students meeting all four CRBs (as seen in the chart below).
Utah isn’t just keeping pace with the national average, they’re one of the states leading the way out of the pandemic-caused learning loss and test score defecits we’re all experiencing. Surpassing national numbers and having more than 50% of students ready for college English are great figures, but that doesn’t mean there’s no room for improvement.
Let’s put it in terms of concrete numbers. If Utah wanted to raise its rates of college readiness to at least 50% in all categories (a good goal, even if still not the desired end point), it would need to improve the Reading scores of about 3,000 students and the Math and Science scores of about 7,300 students.
This may seem like a lot of work, but it’s a more attainable goal than you might think. For instance, about 2,700 Utah students were within 1 point of meeting the Reading CRB—raising the scores of that cohort plus another 300 students would put the numbers over 50%. (The gap is wider when considering Math and Science scores.)
Utah’s Racial Achievement Gaps
Nationally, there is a concerning correlation between a student’s racial background and their likelihood of ACT success. In general, Asian Americans have the highest rates of success, followed by white students. Students who identify as Black or African American score the lowest (Hispanic students, and students of other races, generally score somewhere in the middle.) It is important to emphasize that this is not a causative relationship. Black students do not score worse than white students, on average, because they are Black; rather, it is that many factors which negatively impact ACT scores tend to disproportionately affect non-white (and non-Asian) students.
At first glance, Utah’s 2022 results reveal a similar racial achievement gap, but with a few important caveats. First, Utahns are overwhelmingly white (65%), and the second-largest group are Hispanic students (16%). Thus, the most useful comparison is between these two groups. Here, indeed, Utah’s results follow the national trend: 40% of white students met 3 or more College Readiness Benchmarks, while only 14% of Hispanic students did so. Closing this achievement gap will take effort, but it’s not an insurmountable challenge.
Utah’s Progress on Economic Achievement Gaps
In addition to race, a student’s economic status is often closely related to their ACT performance. Nationwide, the achievement gap between students whose family income is less than $36,000 a year (classified as “low income”) and those whose family income exceeds that amount is very wide: when comparing students who meet 3 or more CRBs, 20 percentage points separate the two groups.
Historically, the economic achievement gaps in Utah are slightly smaller than that of the nation—around 18 percentage points separated non-low income and low income students that met 3+ CRBs in 2020—but the data is… unusual when it comes to 2021 and 2022. Low income and non-low income students have the same figures this year (about a third of all students met 3 or 4 CRBs), but that may be due to only 588 low income Utah juniors taking the ACT in 2021. About 1,000 Utah juniors classified as low income took it in 2020, and 10 percentage points separated their performance and that of non-low income students.
The percent of Utahns taking the exam rose since last year, despite fewer low income students taking the exam. This is easier to fathom once you see that the amount of low income students in Utah taking the exam has steadily decreased since 2015 (7,600 in the class of 2015, 6,700 in 2017, 4,200 in 2019), which isn’t very surprising for the state with the smallest weath gap in the nation. It looks like Utah’s strides towards this economic achievement gap might’ve been simply reducing the number of low income families—we hope to see the full picture of Utah’s ACT scores once again in the near future for some clarity.
How to Improve ACT Scores
Luckily for students of all racial and economic backgrounds looking to increase their chances of ACT success, there are several actions they can take which are statistically likely to improve their scores.
- Focus on schoolwork and take academically challenging classes. Students who do better in school nearly always do better overall on standardized tests like the ACT. For instance, 52% of 2020 Utah seniors who took the “Core” curriculum (four years of English and three years each of mathematics, social studies, and natural sciences) met 3 or more CRBs, while only 24% of seniors who did not meet “Core” standards did so.
- Take the ACT more than once. There is a clear statistical advantage to retesting, even according to the ACT; in 2022, Utah students who took the ACT two or more times had an average composite score 5.4 points higher than those who took the test only once. Students worried about the cost of retesting should consider ACT’s fee waiver program, which allows eligible students to test for free.
- Spend time studying and preparing specifically for the ACT. Taking practice tests helps students familiarize themselves with the content and the format of the test and gives them specific feedback. In addition, working with a tutor can be an effective way of improving a student’s weakest areas and developing test-taking strategies. Piqosity offers a full suite of free ACT Practice materials and analyses of previously-released ACT tests, perfect for students wondering how to improve their ACT scores.
Utah’s Colleges are Popular and Affordable
If Utah’s Class of 2022 is anything like their 2020 peers, most of them are planning to remain within the borders of the Beehive State for college. 2022 Seniors sent an overwhelming majority (more than 80%) of their ACT score reports to in-state colleges; their top five selections were:
- University of Utah
- Utah Valley University
- Utah State University
- Utah Tech University (formerly known as Dixie State University)
- Weber State University
While high ACT scores make any student an attractive candidate, all of these five except Utah Tech will consider students for admission without test scores. (Some require ACT scores if students wish to be considered for academic scholarships, and may also use ACT scores to help determine class placement.)
Historically, the average ACT score of admitted students at these schools is in the low-mid 20s. (At University of Utah, for instance, it’s a 26, while at Weber State it’s a 21.) Admittedly, this is somewhat above Utah’s 2020 average of 20.2, which might suggest that less than half of Utah graduates are likely to get into a popular state school. But it’s more useful to only consider the scores of those students who are actually planning to attend college, rather than the entire graduating class. Using this metric, the average score is a 22.7, well within the range needed for acceptance at most in-state schools.
Regardless of where students end up, Utah colleges are easily within the financial reach of many students. For instance, all of the five schools listed above rank within the Top 11 Most Affordable Colleges at which to obtain a bachelor’s degree (the yearly tuition of all five is under $10,000).
The Best High Schools in Utah by ACT Scores
The following table presents data from 193 Utah high schools for which full data was available. Scores presented here are from then-11th graders who took the ACT in 2021 (most of whom then graduated as part of the Class of 2022). Two schools tied for 7th place, Skyline High and Karl G. Maeser Prep. Academy with a 23.3 composite score.
The Top 10 Best Utah High Schools by 2022 Average ACT Scores (Composite)
- InTech Collegiate High School (24.9)
- Utah County Academy of Science (24.5)
- Northern Utah Academy for Math, Engineering, and Science – Davis Campus (24.4)
- Success Academy at Southern Utah University (24.2)
- Academy for Math Engineering and Science (24.1)
- Success Academy at DSU (23.9)
- Skyline High & Karl G. Maeser Preparatory Academy (23.3)
- Northern Utah Academy for Math, Engineering, and Science – Ogden Campus (22.9)
- Park City High (22.5)
- Farmington High (22.4)
How to Read This Sortable Table
- The default sort is by composite score from highest to lowest; to change the sorting order, click on the header by which you want to sort
- “Avg Score” is the composite ACT score from 0 to 36
- “English, Reading, Math, Science” refers to the school’s average scores in each subject test from 0 to 36
Utah ACT Scores 2023
| wdt_ID | School | School District | Composite | English | Reading | Math | Science |
|---|---|---|---|---|---|---|---|
| 1 | American Fork High | Alpine District | 20.70 | 19.80 | 22.00 | 19.70 | 20.70 |
| 2 | Lehi High | Alpine District | 19.70 | 17.60 | 21.00 | 19.60 | 20.00 |
| 3 | Lone Peak High | Alpine District | 22.00 | 21.80 | 23.20 | 20.80 | 21.60 |
| 4 | Mountain View High | Alpine District | 18.50 | 17.00 | 19.80 | 17.80 | 18.80 |
| 5 | Orem High | Alpine District | 19.20 | 17.60 | 20.40 | 18.90 | 19.40 |
| 6 | Pleasant Grove High | Alpine District | 19.90 | 18.20 | 21.30 | 19.70 | 19.80 |
| 7 | Timpanogos High | Alpine District | 20.50 | 18.50 | 22.50 | 19.90 | 20.70 |
| 8 | Cedar Valley High | Alpine District | 19.00 | 17.20 | 20.70 | 18.30 | 19.40 |
| 9 | Summit High | Alpine District | 15.10 | 14.10 | 16.50 | 14.10 | 15.40 |
| 10 | Polaris High School | Alpine District | 15.80 | 13.60 | 17.20 | 16.00 | 16.20 |
| 11 | Skyridge High School | Alpine District | 21.10 | 19.60 | 22.30 | 20.60 | 21.20 |
| 12 | Westlake High | Alpine District | 20.30 | 18.20 | 21.70 | 20.20 | 20.40 |
| 13 | Beaver High | Beaver District | 18.00 | 16.30 | 18.60 | 18.50 | 17.90 |
| 14 | Milford High | Beaver District | 16.30 | 14.80 | 16.50 | 16.40 | 16.80 |
| 15 | Bear River High | Box Elder District | 19.30 | 18.10 | 20.20 | 19.10 | 19.50 |
| 16 | Box Elder High | Box Elder District | 20.10 | 19.00 | 20.90 | 19.20 | 20.60 |
| 17 | Sunrise High School | Box Elder District | 15.60 | 15.30 | 16.90 | 14.60 | 15.20 |
| 18 | Mountain Crest High | Cache District | 20.00 | 18.50 | 21.00 | 20.20 | 19.90 |
| 19 | Green Canyon High School | Cache District | 20.20 | 18.50 | 21.80 | 19.70 | 20.40 |
| 20 | Ridgeline High School | Cache District | 21.10 | 19.20 | 22.30 | 21.40 | 20.80 |
| 21 | Sky View High | Cache District | 20.20 | 18.20 | 21.80 | 19.60 | 20.70 |
| 22 | Cache High | Cache District | 15.60 | 14.30 | 16.60 | 15.40 | 15.80 |
| 23 | Carbon High | Carbon District | 18.50 | 17.50 | 19.30 | 17.70 | 19.00 |
| 24 | Manila High | Daggett District | 19.40 | 19.10 | 20.10 | 18.70 | 18.80 |
| 25 | Bountiful High | Davis District | 21.20 | 20.30 | 22.50 | 20.70 | 20.90 |
| School | School District | Composite | English | Reading | Math | Science |
Get Prepared for the ACT with Piqosity
If you’re a student preparing for the ACT and looking for ways to improve your test readiness, Piqosity is here to help! Piqosity is a simple, all-in-one learning platform for students who want to score better on their ACT in less time. Our tools monitor your progress to tell you exactly what you need to practice to reach your desired score.
We offer a full suite of ACT test prep materials: 10 full-length ACT practice tests, over 70 distinct concept lessons, personalized practice software, and much more.
The best part? You can try out all of Piqosity’s features with our free community account. When you’re ready to upgrade, Piqosity’s year-long accounts start at only $89. Plus, get a 10% off coupon just by signing up for our mailing list!
For the full datasets referenced in this article:

Your comparisons are ridiculous. Intech has 201 students from grades 7 to 12. How many of them took the ACT last year? I’m betting it was a LOT fewer than all the comprehensive high schools with over 2000 students in grades 10 to 12.
Hi Chris! You’re right that specialized magnet schools like Intech definitely benefit from a student selection bias versus general enrollment high schools. However, our research indicates that Utah generally tests close to 100% of all 11th grade students. This data is from the Utah Department of Education.
It seems that Utah is ahead in all 4 categories, but collectively, they are behind the national average. Then again, my ACT score was awful.