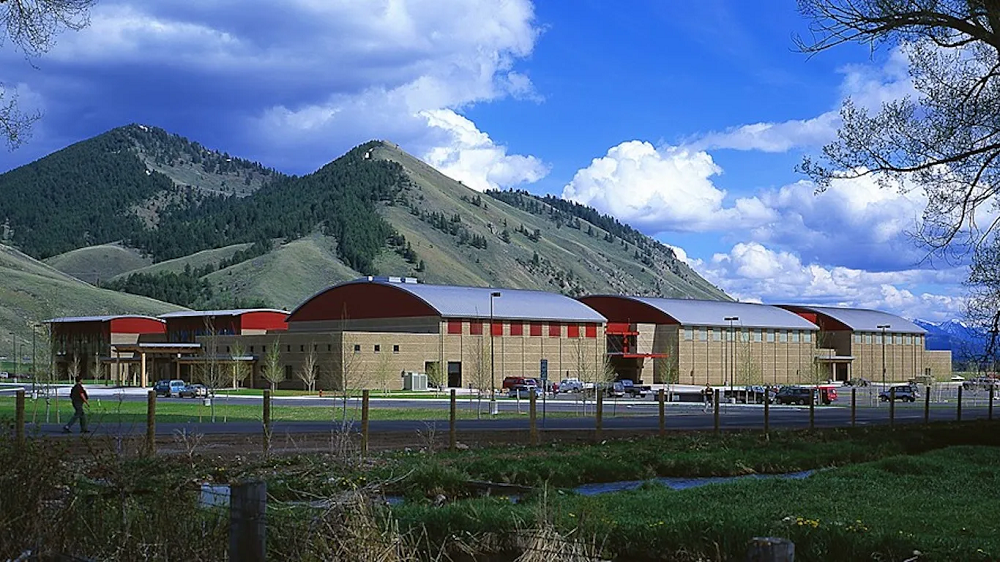
Jackson Hole High School and Pinedale High School, according to their students’ ACT scores, are the best Wyoming high schools—both schools tied with the highest average composite ACT score in Wyoming’s class of 2022 with an average of 21.2 out of 36.
Wyoming’s Class of 2022 included 6,137 students who took the ACT; they scored a mean composite of 19.2 out of a possible 36. (For context, 2019’s graduating class had about 100 more students and scored slightly higher, with a mean composite of 19.8.) Nationally, the average composite score was a 19.8 in 2022 (down from 2020’s mean composite of 20.6).
A high school’s average ACT scores can reveal a lot—they are usually a reliable indicator of college- and career-readiness, and the best high schools are those which adequately prepare their students for college or a career. This article examines general trends in Wyoming’s 2022 ACT scores with a focus on the top-scoring high schools across the state.
(Top image caption—Jackson Hole High School in Teton County has Wyoming’s highest average ACT scores. Photo by Greg Hursley.)
For over a decade, Wyoming has administered the ACT to all high school juniors; consequently, the state’s data gives a remarkably full picture of its students’ aptitude and progress. In 2022, Wyoming was one of 6 states where an estimated 100% of graduates took the ACT; among these, it had the highest average scores! Among the states with 100% testing rates, Tennessee scored second-highest (18.6), and Nevada had the lowest average score (17.3).
Wyoming Scores in Context
In general, states with higher testing levels tend to have lower average scores. One main reason for this is that they include results from students whose future plans may not include college-level coursework. In states where standardized testing like the ACT is optional, test-takers are primarily a self-selecting, academically advanced cohort, which is reflected in their test scores.
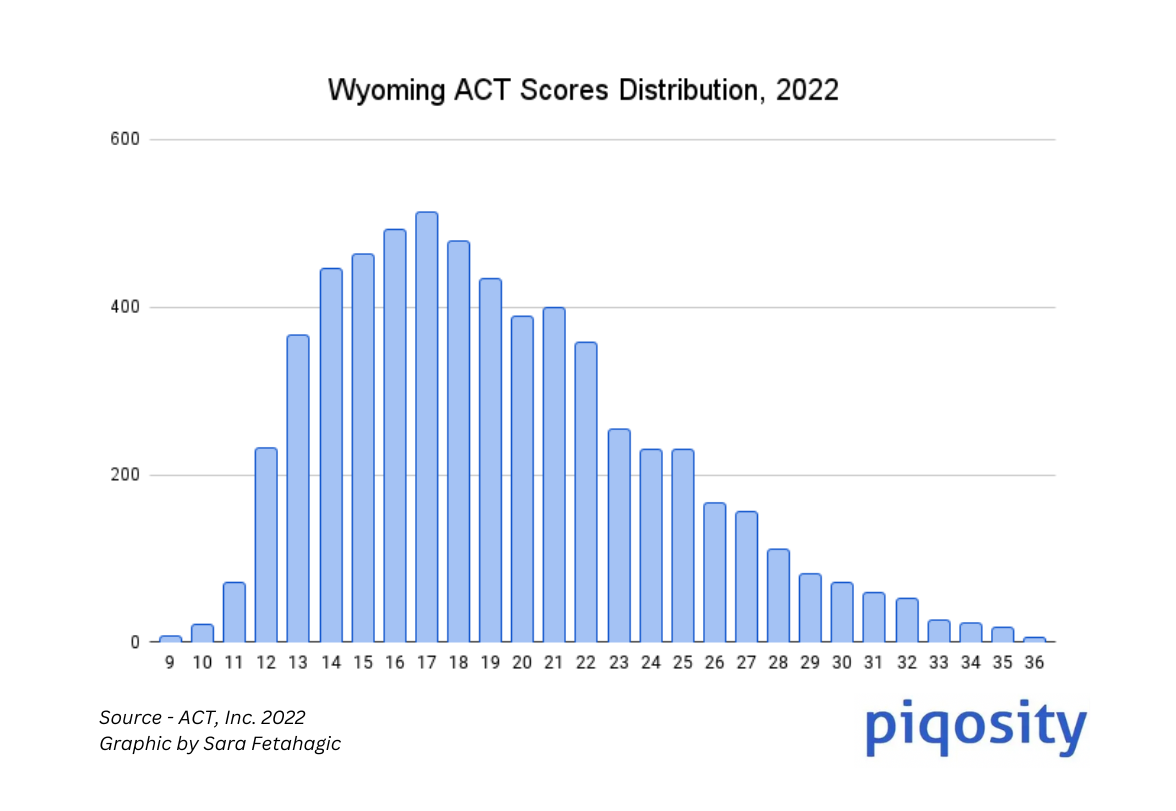
Wyoming has the smallest population of any American state; correspondingly, its senior class sizes tend to be small, too. What this means from a testing perspective is that each individual score has a greater impact on the state’s (or a school’s) average. The chart below depicts Wyoming’s average score distribution in 2022. If just one more student had been added to each group scoring above a 19.0, Wyoming’s average score would have risen from a 19.2 to a 19.3.
As we’ve noted, not all students plan to pursue post-secondary education, but in a state like Wyoming, they will still have to take the ACT. It’s not hard to imagine, then, that in some cases, these students may “take” the test but not actually complete it, resulting in an artificially low score. In a state with a higher population like neighboring Nebraska, these outliers will have a much smaller effect than they do in Wyoming.
ACT College Readiness Benchmarks
The ACT’s “College Readiness Benchmarks” are the scores (out of 36) on the subject area tests that indicate a student’s chances of college success. The ACT believes that meeting the benchmarks for English, Reading, Mathematics, and Science gives a student a 50% chance of earning a B or higher or a 75% chance of getting a C or higher in a corresponding freshman-level college course. Unchanged since 2013, these benchmark scores and their college course equivalents are:
- English (English Composition) – 18
- Reading (Social Sciences) – 22
- Math (College Algebra) – 22
- Science (Biology) – 23
Since 2015, the ACT has also offered a College Readiness Benchmark for coursework in STEM (science, technology, engineering, and math), based on scores on the Math & Science subject area tests. Because college-level STEM coursework tends to be more academically challenging (for instance, many STEM freshmen begin with Calculus instead of Algebra), ACT has determined that the benchmark ACT score is significantly higher for STEM than in other subject areas. Meeting the STEM benchmark indicates a 50% chance of earning a B or higher in identified college-level STEM courses. The benchmark score is: Math & Science (STEM) – 26
Many Wyoming Juniors Are Not College-Ready
When comparing Wyoming to the national average for students meeting ACT College Readiness Benchmarks (CRBs), it’s clear that the Class of 2020 lags behind in all areas. Wyoming graduates are most college-ready in English, with just over half (52%) of graduates meeting the CRB. But the numbers are lower in other subject areas, with 38% meeting the Reading benchmark, and just under one-third showing college readiness in Math (31%) and Science (29%).
But as discussed above, Wyoming’s small population makes improving these rates a much more attainable goal. Let’s put it in terms of concrete numbers: imagine Wyoming wanted to match its rates of college readiness to the national average in all categories (a good goal to start with). To accomplish this it would need to improve the scores of less than 500 students.
Not only would Wyoming not need to improve that many students’ scores, they wouldn’t need to increase them by all that much. For instance, in 2020, 442 Wyoming students were within 1 point of meeting the Science CRB—raising the scores of that cohort alone would close the gap between Wyoming and the national average. (The numbers are similar for other subjects.)
Does Wyoming Face Achievement Gaps?
Nationally, there is a concerning correlation between a student’s racial background and their likelihood of ACT success. In general, Asian Americans have the highest rates of success, followed by white students. Students who identify as Black or African American score the lowest (Hispanic students, and students of other races, generally score somewhere in the middle.) It is important to emphasize that this is not a causative relationship. Black students do not score worse than white students, on average, because they are Black; rather, it is that many factors which negatively impact ACT scores tend to disproportionately affect non-white (and non-Asian) students.
Wyoming’s Class of 2022 is overwhelmingly white (7o%); the second-largest group—Hispanic students—makes up only 13%. So while it is technically accurate to identify a racial achievement gap between, say, white and Black students in Wyoming, it’s important to keep in mind that there were fewer than 70 Black students tested in 2022. (Here again, an outlier score will have an outsized impact.)
In addition to race, a student’s economic status is often closely related to their ACT performance. Nationwide, the achievement gap between students whose family income is less than $36,000 a year (classified as “low income”) and those whose family income exceeds that amount is very wide: when comparing students who meet 3 or more CRBs, over 20 percentage points separate the two groups.
In Wyoming, this gap is nearly half the size—around 12 percentage points. Again, we’re looking at a fairly small number of people; in 2020, fewer than 1,000 students were classified as “low income.”
How to Improve ACT Scores
Luckily for students of all racial and economic backgrounds looking to increase their chances of ACT success, there are several actions they can take which are statistically likely to improve their scores.
- Focus on schoolwork and take academically challenging classes. Students who do better in school nearly always do better overall on standardized tests like the ACT. For instance, Wyoming seniors who took four years of high school English scored an average of over 3 points higher than who took less than four years.
- Take the ACT more than once. There is a clear statistical advantage to retesting, even according to the ACT; in 2022, about half of Wyoming students who took the ACT two or more times showed college readiness in at least three subject areas, compared to only around 20% of students who took the test only once. Students worried about the cost of retesting should consider ACT’s fee waiver program, which allows eligible students to test for free.
- Spend time studying and preparing specifically for the ACT. Taking practice tests helps students familiarize themselves with the content and the format of the test and gives them specific feedback. In addition, working with a tutor can be an effective way of improving a student’s weakest areas and developing test-taking strategies. Piqosity offers a full suite of free ACT Practice materials and analyses of previously-released ACT tests, perfect for students wondering how to improve their ACT scores.
Wyoming’s Colleges are Attainable and Affordable
If Wyoming’s college-bound seniors are anything like their peers in previous years, about half of them are planning to remain close to home. 2019 Seniors, for instance, sent 64% of their ACT score reports to in-state colleges; their top five selections were:
- University of Wyoming
- Casper College
- Laramie County Community College
- Sheridan College
- Central Wyoming College
High ACT scores generally make any student an attractive candidate—the University of Wyoming used to have both a GPA and ACT requirement (a composite average of 21) for assured admission, but test scores are currently no longer required for admission.
High ACT scores can also be a boon to students looking for additional financial aid. At Sheridan College, for instance, applicants who scored at least a 25.0 on the ACT are eligible for the High Academic Achievement Scholarship, which can be used for 4 consecutive semesters to cover in-state tuition & fees. (About 16% of 2022 seniors would qualify for this award.)
Regardless of where students end up, Wyoming colleges are well within the financial reach of many students— the in-state tuition of all five schools listed above is under $4,000.
Best High Schools in Wyoming by ACT Scores
The following table presents data from 73 Wyoming high schools for which full data was available. (Note: Schools which tested fewer than 10 students are not included.) The scores presented here are from then-11th graders who took the ACT in 2021, most of whom then graduated as part of the Class of 2022.
This year, the top Wyoming high schools’ composite scores are neck-in-neck, resulting in several ties in this ranking: two schools tied for 1st place, three tied for 2nd, three tied for 4th, and two tied for both 5th and 9th. See subject scores breakdown for further delineation.
Top 10 Wyoming High Schools by 2022 Average ACT Scores (Composite)
- Jackson Hole High School & Pinedale High School (21.2)
- Meeteetse School, Central High School, & Burlington High School (21.1)
- Star Valley High School (20.9)
- Riverside Middle/High School, Lander Valley High School, & Kemmerer Junior Senior High School (20.8)
- Sheridan High School & Hot Springs County High School (20.7)
- Southeast High School (20.6)
- Big Piney High School (20.5)
- Rocky Mountain High School (20.4)
- Saratoga Middle/High School & Buffalo High School (20.3)
- Cody High School (20.2)
How to Read This Sortable Table
- The default sort is by composite score from highest to lowest; to change the sorting order, click on the header by which you want to sort
- “Avg Score” is the composite ACT score from 0 to 36
- “English, Reading, Math, Science” refers to the school’s average scores in each subject test from 0 to 36
- “# Tested” indicates the number of students whose scores are being averaged
Wyoming ACT Scores 2023
| wdt_ID | School Name | School District Name | Average Composite | Average English | Average Math | Average Reading | Average Science | # Tested |
|---|---|---|---|---|---|---|---|---|
| 1 | Laramie High School | Albany #1 | 19.90 | 18.20 | 20.00 | 20.90 | 19.90 | 246 |
| 2 | Whiting High School | Albany #1 | 16.60 | 14.90 | 17.20 | 17.10 | 17.10 | 10 |
| 3 | Burlington High School | Big Horn #1 | 21.10 | 19.90 | 20.80 | 21.90 | 21.40 | 18 |
| 4 | Rocky Mountain High School | Big Horn #1 | 20.40 | 18.90 | 19.60 | 21.60 | 21.00 | 52 |
| 5 | Lovell High School | Big Horn #2 | 19.70 | 18.70 | 18.70 | 20.70 | 20.10 | 40 |
| 6 | Greybull High School | Big Horn #3 | 19.10 | 16.70 | 19.20 | 21.40 | 19.00 | 25 |
| 7 | Riverside Middle/High School | Big Horn #4 | 20.80 | 19.20 | 20.70 | 22.50 | 20.70 | 20 |
| 8 | Campbell County High School | Campbell #1 | 19.20 | 17.20 | 18.80 | 20.20 | 19.60 | 219 |
| 9 | Wright Jr. & Sr. High School | Campbell #1 | 18.90 | 17.50 | 18.40 | 19.20 | 19.60 | 19 |
| 10 | Westwood High School | Campbell #1 | 16.80 | 16.00 | 16.50 | 17.40 | 17.00 | 41 |
| 11 | Thunder Basin High School | Campbell #1 | 19.90 | 18.60 | 19.80 | 20.70 | 20.10 | 238 |
| 12 | Little Snake River Valley School | Carbon #1 | 18.90 | 16.60 | 19.40 | 18.60 | 20.50 | 10 |
| 13 | Rawlins High School | Carbon #1 | 17.70 | 15.70 | 17.20 | 18.70 | 18.70 | 87 |
| 14 | HEM Junior/Senior High School | Carbon #2 | 19.90 | 18.90 | 19.00 | 21.00 | 19.80 | 13 |
| 15 | Saratoga Middle/High School | Carbon #2 | 20.30 | 19.40 | 20.10 | 19.30 | 21.80 | 12 |
| 16 | Douglas High School | Converse #1 | 19.00 | 18.00 | 19.30 | 18.90 | 19.40 | 127 |
| 17 | Glenrock Jr/Sr High School | Converse #2 | 17.50 | 16.60 | 17.40 | 17.50 | 18.30 | 36 |
| 18 | Sundance Secondary School | Crook #1 | 17.90 | 17.10 | 17.60 | 17.70 | 18.50 | 24 |
| 19 | Hulett School | Crook #1 | 18.10 | 17.20 | 17.30 | 20.00 | 17.70 | 20 |
| 20 | Moorcroft High School | Crook #1 | 18.30 | 15.60 | 19.70 | 18.10 | 19.40 | 31 |
| 21 | Lander Valley High School | Fremont #1 | 20.80 | 19.40 | 20.00 | 22.10 | 21.30 | 100 |
| 22 | Dubois High School | Fremont #2 | 17.60 | 15.70 | 17.60 | 18.40 | 18.70 | 10 |
| 23 | Wind River High School | Fremont #6 | 15.60 | 15.50 | 15.20 | 15.50 | 15.70 | 15 |
| 24 | Wyoming Indian High School | Fremont #14 | 13.60 | 10.90 | 14.70 | 14.30 | 14.00 | 30 |
| 25 | Ft. Washakie High School | Fremont #21 | 14.60 | 12.10 | 13.50 | 16.10 | 16.20 | 14 |
| School Name | School District Name | Average Composite | Average English | Average Math | Average Reading | Average Science | # Tested |
Get Prepared for the ACT with Piqosity
If you’re a student preparing for the ACT and looking for ways to improve your test readiness, Piqosity is here to help! Piqosity is a simple, all-in-one learning platform for students who want to score better on their ACT in less time. Our tools monitor your progress to tell you exactly what you need to practice to reach your desired score.
We offer a full suite of ACT test prep materials: 10 full-length ACT practice tests, over 70 distinct concept lessons, personalized practice software, and much more.
The best part? You can try out all of Piqosity’s features with our free community account. When you’re ready to upgrade, Piqosity’s year-long accounts start at only $89. Plus, get a 10% off coupon just by signing up for our mailing list!
For the full datasets referenced in this article:
- Average ACT Scores by State Graduating Class of 2022
- ACT Database for US ACT Score Trends in the Class of 2022
- 2022 ACT Scores of Wyoming High Schools
More Educational Resources by Piqosity:

Leave A Comment